|
|
You are here: Foswiki>ITB Web>PerformanceCharacterizationForVM (10 Feb 2011, SuchandraThapa)Edit Attach
PerformanceCharacterizationForVM
- Introduction
- Setup
- Iperf testing
- Bonnie++ testing
- Iozone testing
- Iozone test definitions
- Physical machine
- File based VM
- File based VM Write
- File based KVM Re-write
- File based VM Read
- File based VM Re-Read
- File based VM Random Read
- File based VM Random Write
- File based VM Backwards Read
- File based VM Record Rewrite
- File based VM Strided Read
- File based VM Fwrite
- File based VM Frewrite
- File based VM Fread
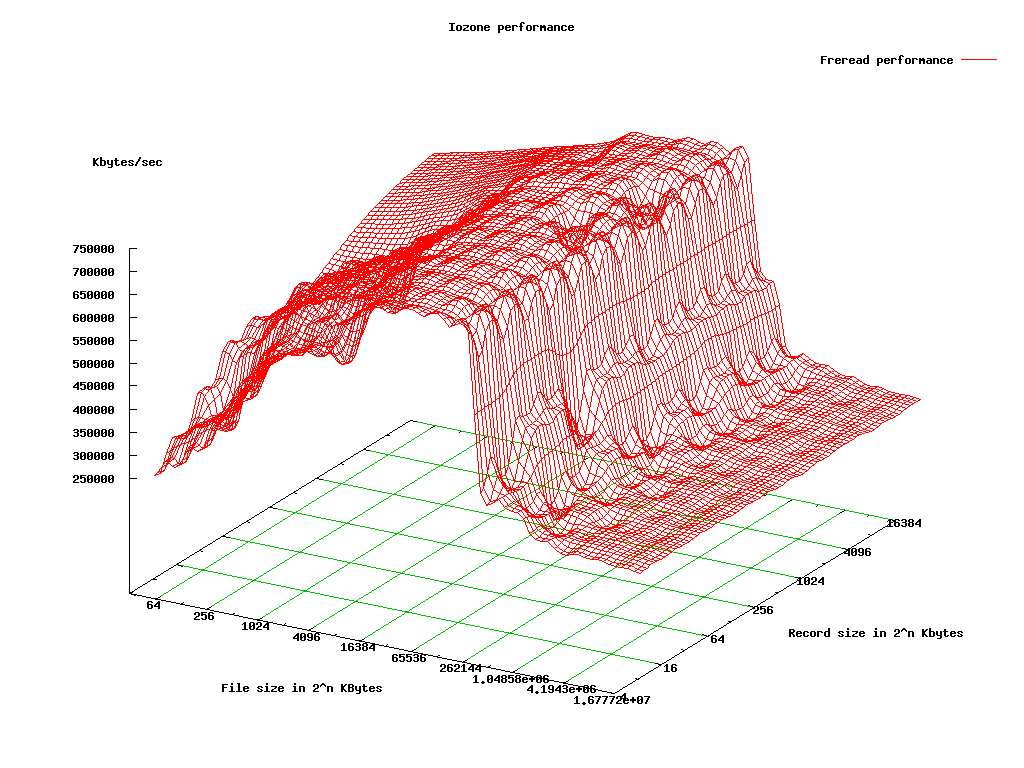
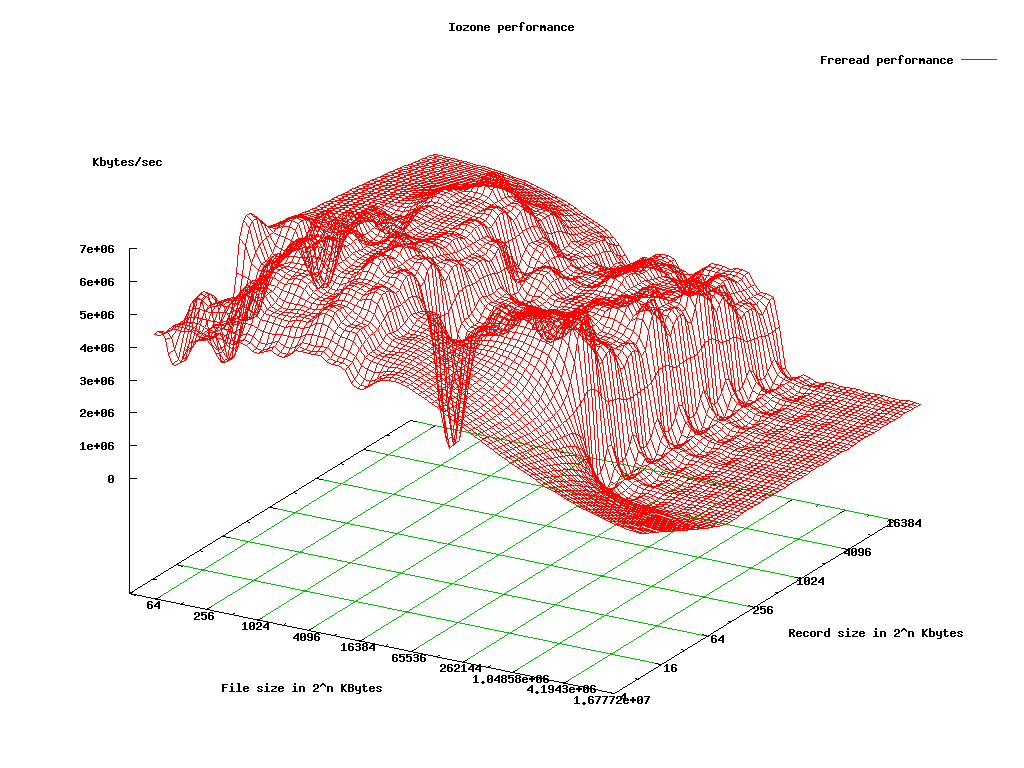
- File based VM Freread
- LVM based VM
- Conclusions
- References
Introduction
In order to understand the tradeoffs between I/O performance using different ways of setting up virtual drives for KVM VMs, bonnie++ and iozone testing of storage I/O performance was undertaken. This page documents the testing and results for three setups: testing on a physical system, testing on a file based VM, and testing on a LVM based VM. Both VMs used virtio based storage and network devices. Although using a non-virtio was considered, the network and storage performance benchmarks available indicated that using virtio is a significant performance gain.Setup
Physical machine
The physical system used for testing is a Dell R610 with 2 E5620 cpus and 24 GB of RAM. The system drive consists of 2 500GB drives in a RAID 1 configuration with 4 500GB drives in a RAID 5. The testing was conducted on a LVM partition on the RAID 5 array.File based VM
This setup was tested on a VM running on the physical system described above. The vm used a 200GB file located on a LVM partition on the RAID 5 array to provide the virtual drive. The vm was also configured with 2 virtual cpus and 1GB of RAM. Virtio was used for NIC and storage drivers.LVM based VM
This setup was tested on a VM running on the physical system described above. The vm used a 200GB LVM partition on the RAID 5 array to provide the virtual drive. The vm was also configured with 2 virtual cpus and 1GB of RAM. Virtio was used for NIC and storage drivers.Iperf testing
For iperf network testing, the physical system and VMs were paired with another system that is connected to the same switch (itb4).TCP testing
Physical host
When the physical machine was running as a server and receiving a connection from itb4, itb4 was able to connect at 941 Mbits/sec. The transfer rate from the physical server to itb4 was 932 Mbits/sec. When itb4 was running as a server and the physical server was a client, it was able to transfer data to itb4 at 939 Mbits/sec. The rate from itb4 to the physical server was 939 Mbits/sec.[root@itb4 ~]# iperf -c itb-kvm2.mwt2.org -r ------------------------------------------------------------ Server listening on TCP port 5001 TCP window size: 85.3 KByte (default) ------------------------------------------------------------ ------------------------------------------------------------ Client connecting to itb-kvm2.mwt2.org, TCP port 5001 TCP window size: 384 KByte (default) ------------------------------------------------------------ [ 5] local 10.1.5.102 port 59009 connected with 10.1.4.122 port 5001 [ ID] Interval Transfer Bandwidth [ 5] 0.0-10.0 sec 1.10 GBytes 941 Mbits/sec [ 4] local 10.1.5.102 port 5001 connected with 10.1.4.122 port 48873 [ 4] 0.0-10.0 sec 1.09 GBytes 932 Mbits/sec [root@itb-kvm2 ~]# iperf -c itb4.mwt2.org -r ------------------------------------------------------------ Server listening on TCP port 5001 TCP window size: 85.3 KByte (default) ------------------------------------------------------------ ------------------------------------------------------------ Client connecting to itb4.mwt2.org, TCP port 5001 TCP window size: 120 KByte (default) ------------------------------------------------------------ [ 4] local 10.1.4.122 port 48872 connected with 10.1.5.102 port 5001 [ ID] Interval Transfer Bandwidth [ 4] 0.0-10.0 sec 1.09 GBytes 939 Mbits/sec [ 5] local 10.1.4.122 port 5001 connected with 10.1.5.102 port 59008 [ 5] 0.0-10.0 sec 1.10 GBytes 939 Mbits/sec
File based VM
When this VM was running as a server and receiving a connection from itb4, itb4 was able to connect at 941 Mbits/sec. The transfer rate from the VM to itb4 was 937 Mbits/sec. When itb4 was running as a server and the VM was a client, it was able to transfer data to itb4 at 939 Mbits/sec. The rate from itb4 to the VM was 939 Mbits/sec.[root@itb4 ~]# iperf -c 10.1.5.134 -r ------------------------------------------------------------ Server listening on TCP port 5001 TCP window size: 85.3 KByte (default) ------------------------------------------------------------ ------------------------------------------------------------ Client connecting to 10.1.5.134, TCP port 5001 TCP window size: 251 KByte (default) ------------------------------------------------------------ [ 5] local 10.1.5.102 port 35353 connected with 10.1.5.134 port 5001 [ ID] Interval Transfer Bandwidth [ 5] 0.0-10.0 sec 1.10 GBytes 941 Mbits/sec [ 4] local 10.1.5.102 port 5001 connected with 10.1.5.134 port 35191 [ 4] 0.0-10.0 sec 1.09 GBytes 937 Mbits/sec [root@itbv-pbs ~]# iperf -c itb4.mwt2.org -r ------------------------------------------------------------ Server listening on TCP port 5001 TCP window size: 85.3 KByte (default) ------------------------------------------------------------ ------------------------------------------------------------ Client connecting to itb4.mwt2.org, TCP port 5001 TCP window size: 331 KByte (default) ------------------------------------------------------------ [ 5] local 10.1.5.134 port 35684 connected with 10.1.5.102 port 5001 [ ID] Interval Transfer Bandwidth [ 5] 0.0-10.0 sec 1.09 GBytes 939 Mbits/sec [ 4] local 10.1.5.134 port 5001 connected with 10.1.5.102 port 54151 [ 4] 0.0-10.0 sec 1.10 GBytes 939 Mbits/sec
LVM based VM
When this VM was running as a server and receiving a connection from itb4, itb4 was able to connect at 941 Mbits/sec. The transfer rate from the VM to itb4 was 935 Mbits/sec. When itb4 was running as a server and the VM was a client, it was able to transfer data to itb4 at 939 Mbits/sec. The rate from itb4 to the VM was 939 Mbits/sec.[root@itb4 ~]# iperf -c 10.1.5.135 -r ------------------------------------------------------------ Server listening on TCP port 5001 TCP window size: 85.3 KByte (default) ------------------------------------------------------------ ------------------------------------------------------------ Client connecting to 10.1.5.135, TCP port 5001 TCP window size: 373 KByte (default) ------------------------------------------------------------ [ 5] local 10.1.5.102 port 56370 connected with 10.1.5.135 port 5001 [ ID] Interval Transfer Bandwidth [ 5] 0.0-10.0 sec 1.10 GBytes 941 Mbits/sec [ 4] local 10.1.5.102 port 5001 connected with 10.1.5.135 port 49239 [ 4] 0.0-10.0 sec 1.09 GBytes 935 Mbits/sec [root@itbv-condor ~]# iperf -c itb4.mwt2.org -r ------------------------------------------------------------ Server listening on TCP port 5001 TCP window size: 85.3 KByte (default) ------------------------------------------------------------ ------------------------------------------------------------ Client connecting to itb4.mwt2.org, TCP port 5001 TCP window size: 282 KByte (default) ------------------------------------------------------------ [ 5] local 10.1.5.135 port 53624 connected with 10.1.5.102 port 5001 [ ID] Interval Transfer Bandwidth [ 5] 0.0-10.0 sec 1.09 GBytes 939 Mbits/sec [ 4] local 10.1.5.135 port 5001 connected with 10.1.5.102 port 33783 [ 4] 0.0-10.0 sec 1.10 GBytes 939 Mbits/sec
Simultaneous testing
Running iperf tests on the physical system and a VM results in the aggregate bandwidth of about ~960-1000 Mbit/s being divided between the iperf clients with the client that starts first getting more bandwidth. The same effect is seen if iperf is run against the two VMs simultaneously.- iperf tests against physical system and VM when iperf against the physical system started first
[root@itb4 ~]# iperf -c 10.1.5.135  -r
------------------------------------------------------------
Server listening on TCP port 5001
TCP window size: 85.3 KByte (default)
------------------------------------------------------------
------------------------------------------------------------
Client connecting to 10.1.5.135, TCP port 5001
TCP window size: 16.0 KByte (default)
------------------------------------------------------------
[  5] local 10.1.5.102 port 57822 connected with 10.1.5.135 port 5001
[ ID] Interval       Transfer     Bandwidth
[  5]  0.0-10.0 sec   405 MBytes   340 Mbits/sec
[  4] local 10.1.5.102 port 5001 connected with 10.1.5.135 port 47995
[  4]  0.0-10.0 sec   828 MBytes   692 Mbits/sec


[root@itb4 ~]# iperf -c itb-kvm2.mwt2.org  -r   -p 12000
------------------------------------------------------------
Server listening on TCP port 12000
TCP window size: 85.3 KByte (default)
------------------------------------------------------------
------------------------------------------------------------
Client connecting to itb-kvm2.mwt2.org, TCP port 12000
TCP window size:  365 KByte (default)
------------------------------------------------------------
[  5] local 10.1.5.102 port 35408 connected with 10.1.4.122 port 12000
[ ID] Interval       Transfer     Bandwidth
[  5]  0.0-10.0 sec   749 MBytes   626 Mbits/sec
[  4] local 10.1.5.102 port 12000 connected with 10.1.4.122 port 45852
[  4]  0.0-10.0 sec   296 MBytes   247 Mbits/sec
- iperf tests against physical system and VM when iperf against the VM started first
[root@itb4 ~]# iperf -c 10.1.5.135  -r
------------------------------------------------------------
Server listening on TCP port 5001
TCP window size: 85.3 KByte (default)
------------------------------------------------------------
------------------------------------------------------------
Client connecting to 10.1.5.135, TCP port 5001
TCP window size:  335 KByte (default)
------------------------------------------------------------
[  5] local 10.1.5.102 port 55860 connected with 10.1.5.135 port 5001
[ ID] Interval       Transfer     Bandwidth
[  5]  0.0-10.0 sec   817 MBytes   685 Mbits/sec
[  4] local 10.1.5.102 port 5001 connected with 10.1.5.135 port 56609
[  4]  0.0-10.0 sec   835 MBytes   698 Mbits/sec

[root@itb4 ~]# iperf -c itb-kvm2.mwt2.org  -r   -p 12000
------------------------------------------------------------
Server listening on TCP port 12000
TCP window size: 85.3 KByte (default)
------------------------------------------------------------
------------------------------------------------------------
Client connecting to itb-kvm2.mwt2.org, TCP port 12000
TCP window size: 16.0 KByte (default)
------------------------------------------------------------
[  5] local 10.1.5.102 port 35929 connected with 10.1.4.122 port 12000
[ ID] Interval       Transfer     Bandwidth
[  5]  0.0-10.0 sec   368 MBytes   309 Mbits/sec
[  4] local 10.1.5.102 port 12000 connected with 10.1.4.122 port 45853
[  4]  0.0-10.0 sec   285 MBytes   239 Mbits/sec
- Iperf against two VMs, iperf against LVM based VM started first
[root@itb4 ~]# iperf -c 10.1.5.135  -r
------------------------------------------------------------
Server listening on TCP port 5001
TCP window size: 85.3 KByte (default)
------------------------------------------------------------
------------------------------------------------------------
Client connecting to 10.1.5.135, TCP port 5001
TCP window size:  384 KByte (default)
------------------------------------------------------------
[  5] local 10.1.5.102 port 36410 connected with 10.1.5.135 port 5001
[ ID] Interval       Transfer     Bandwidth
[  5]  0.0-10.0 sec   832 MBytes   696 Mbits/sec
[  4] local 10.1.5.102 port 5001 connected with 10.1.5.135 port 39345
[  4]  0.0-10.2 sec   441 MBytes   361 Mbits/sec

[root@itb4 ~]# iperf -c 10.1.5.134  -r   -p 13000
------------------------------------------------------------
Server listening on TCP port 13000
TCP window size: 85.3 KByte (default)
------------------------------------------------------------
------------------------------------------------------------
Client connecting to 10.1.5.134, TCP port 13000
TCP window size: 16.0 KByte (default)
------------------------------------------------------------
[  5] local 10.1.5.102 port 56694 connected with 10.1.5.134 port 13000
[ ID] Interval       Transfer     Bandwidth
[  5]  0.0-10.0 sec   362 MBytes   304 Mbits/sec
[  4] local 10.1.5.102 port 13000 connected with 10.1.5.134 port 47711
[  4]  0.0-10.0 sec   683 MBytes   571 Mbits/sec
- Iperf against two VMs, iperf against file based VM started first
[root@itb4 ~]# iperf -c 10.1.5.135  -r
------------------------------------------------------------
Server listening on TCP port 5001
TCP window size: 85.3 KByte (default)
------------------------------------------------------------
------------------------------------------------------------
Client connecting to 10.1.5.135, TCP port 5001
TCP window size:  346 KByte (default)
------------------------------------------------------------
[  5] local 10.1.5.102 port 36413 connected with 10.1.5.135 port 5001
[ ID] Interval       Transfer     Bandwidth
[  5]  0.0-10.0 sec   419 MBytes   351 Mbits/sec
[  4] local 10.1.5.102 port 5001 connected with 10.1.5.135 port 39346
[  4]  0.0-10.0 sec   372 MBytes   312 Mbits/sec

[root@itb4 ~]# iperf -c 10.1.5.134  -r   -p 13000
------------------------------------------------------------
Server listening on TCP port 13000
TCP window size: 85.3 KByte (default)
------------------------------------------------------------
------------------------------------------------------------
Client connecting to 10.1.5.134, TCP port 13000
TCP window size:  342 KByte (default)
------------------------------------------------------------
[  5] local 10.1.5.102 port 56695 connected with 10.1.5.134 port 13000
[ ID] Interval       Transfer     Bandwidth
[  5]  0.0-10.0 sec   733 MBytes   615 Mbits/sec
[  4] local 10.1.5.102 port 13000 connected with 10.1.5.134 port 59992
[  4]  0.0-10.0 sec   748 MBytes   625 Mbits/sec
UDP testing
Physical host
When the physical machine was running as a server and receiving a connection from itb4, itb4 was able to connect at 1.05 Mbits/sec with no loss of datagrams, a latency of 0.181 ms, and a jitter of 0.002 ms (client) / 0.009 ms (serve) . When itb4 was running as a server and the physical server was a client, it was able to transfer data to itb4 at 1.05 Mbits/sec with no loss of datagrams, a latency of 0.157 ms, and a jitter of 0.007ms (client) / 0.004ms (server).[root@itb4 ~]# iperf -c itb-kvm2.mwt2.org -r -u ------------------------------------------------------------ Server listening on UDP port 5001 Receiving 1470 byte datagrams UDP buffer size: 126 KByte (default) ------------------------------------------------------------ ------------------------------------------------------------ Client connecting to itb-kvm2.mwt2.org, UDP port 5001 Sending 1470 byte datagrams UDP buffer size: 126 KByte (default) ------------------------------------------------------------ [ 4] local 10.1.5.102 port 43042 connected with 10.1.4.122 port 5001 [ ID] Interval Transfer Bandwidth [ 4] 0.0-10.0 sec 1.25 MBytes 1.05 Mbits/sec [ 4] Sent 893 datagrams [ 4] Server Report: [ 4] 0.0-10.0 sec 1.25 MBytes 1.05 Mbits/sec 0.002 ms 0/ 893 (0%) [ 3] local 10.1.5.102 port 5001 connected with 10.1.4.122 port 60704 [ 3] 0.0-10.0 sec 1.25 MBytes 1.05 Mbits/sec 0.009 ms 0/ 893 (0%) [root@itb4 ~]# ping -c 10 itb-kvm2.mwt2.org PING itb-kvm2.mwt2.org (10.1.4.122) 56(84) bytes of data. 64 bytes from itb-kvm2.mwt2.org (10.1.4.122): icmp_seq=1 ttl=64 time=0.202 ms 64 bytes from itb-kvm2.mwt2.org (10.1.4.122): icmp_seq=2 ttl=64 time=0.189 ms 64 bytes from itb-kvm2.mwt2.org (10.1.4.122): icmp_seq=3 ttl=64 time=0.133 ms 64 bytes from itb-kvm2.mwt2.org (10.1.4.122): icmp_seq=4 ttl=64 time=0.133 ms 64 bytes from itb-kvm2.mwt2.org (10.1.4.122): icmp_seq=5 ttl=64 time=0.181 ms 64 bytes from itb-kvm2.mwt2.org (10.1.4.122): icmp_seq=6 ttl=64 time=0.173 ms 64 bytes from itb-kvm2.mwt2.org (10.1.4.122): icmp_seq=7 ttl=64 time=0.179 ms 64 bytes from itb-kvm2.mwt2.org (10.1.4.122): icmp_seq=8 ttl=64 time=0.191 ms 64 bytes from itb-kvm2.mwt2.org (10.1.4.122): icmp_seq=9 ttl=64 time=0.224 ms 64 bytes from itb-kvm2.mwt2.org (10.1.4.122): icmp_seq=10 ttl=64 time=0.206 ms --- itb-kvm2.mwt2.org ping statistics --- 10 packets transmitted, 10 received, 0% packet loss, time 9001ms rtt min/avg/max/mdev = 0.133/0.181/0.224/0.028 ms [root@itb-kvm2 iozone]# iperf -c itb4.mwt2.org -r -u ------------------------------------------------------------ Server listening on UDP port 5001 Receiving 1470 byte datagrams UDP buffer size: 124 KByte (default) ------------------------------------------------------------ ------------------------------------------------------------ Client connecting to itb4.mwt2.org, UDP port 5001 Sending 1470 byte datagrams UDP buffer size: 124 KByte (default) ------------------------------------------------------------ [ 4] local 10.1.4.122 port 60853 connected with 10.1.5.102 port 5001 [ ID] Interval Transfer Bandwidth [ 4] 0.0-10.0 sec 1.25 MBytes 1.05 Mbits/sec [ 4] Sent 893 datagrams [ 4] Server Report: [ 4] 0.0-10.0 sec 1.25 MBytes 1.05 Mbits/sec 0.004 ms 0/ 893 (0%) [ 3] local 10.1.4.122 port 5001 connected with 10.1.5.102 port 36394 [ 3] 0.0-10.0 sec 1.25 MBytes 1.05 Mbits/sec 0.007 ms 0/ 893 (0%) [root@itb-kvm2 iozone]# ping -c 10 itb4.mwt2.org PING itb4.mwt2.org (10.1.5.102) 56(84) bytes of data. 64 bytes from itb4.mwt2.org (10.1.5.102): icmp_seq=1 ttl=64 time=0.159 ms 64 bytes from itb4.mwt2.org (10.1.5.102): icmp_seq=2 ttl=64 time=0.162 ms 64 bytes from itb4.mwt2.org (10.1.5.102): icmp_seq=3 ttl=64 time=0.159 ms 64 bytes from itb4.mwt2.org (10.1.5.102): icmp_seq=4 ttl=64 time=0.160 ms 64 bytes from itb4.mwt2.org (10.1.5.102): icmp_seq=5 ttl=64 time=0.158 ms 64 bytes from itb4.mwt2.org (10.1.5.102): icmp_seq=6 ttl=64 time=0.159 ms 64 bytes from itb4.mwt2.org (10.1.5.102): icmp_seq=7 ttl=64 time=0.136 ms 64 bytes from itb4.mwt2.org (10.1.5.102): icmp_seq=8 ttl=64 time=0.166 ms 64 bytes from itb4.mwt2.org (10.1.5.102): icmp_seq=9 ttl=64 time=0.160 ms 64 bytes from itb4.mwt2.org (10.1.5.102): icmp_seq=10 ttl=64 time=0.158 ms --- itb4.mwt2.org ping statistics --- 10 packets transmitted, 10 received, 0% packet loss, time 8999ms rtt min/avg/max/mdev = 0.136/0.157/0.166/0.016 ms
File based VM
When the VM was running as a server and receiving a connection from itb4, itb4 was able to connect at 1.05 Mbits/sec with no loss of datagrams, a latency of 0.294 ms, and a jitter of 0.010 ms (server) / 0.007 ms (client) . When itb4 was running as a server and the VM was a client, it was able to transfer data to itb4 at 1.05 Mbits/sec with no loss of datagrams, a latency of 0.362 ms, and a jitter of 0.005 ms (server) / 0.010 ms (client).[root@itb4 ~]# iperf -c 10.1.5.134 -r -u ------------------------------------------------------------ Server listening on UDP port 5001 Receiving 1470 byte datagrams UDP buffer size: 126 KByte (default) ------------------------------------------------------------ ------------------------------------------------------------ Client connecting to 10.1.5.134, UDP port 5001 Sending 1470 byte datagrams UDP buffer size: 126 KByte (default) ------------------------------------------------------------ [ 4] local 10.1.5.102 port 39130 connected with 10.1.5.134 port 5001 [ ID] Interval Transfer Bandwidth [ 4] 0.0-10.0 sec 1.25 MBytes 1.05 Mbits/sec [ 4] Sent 893 datagrams [ 4] Server Report: [ 4] 0.0-10.0 sec 1.25 MBytes 1.05 Mbits/sec 0.010 ms 0/ 893 (0%) [ 3] local 10.1.5.102 port 5001 connected with 10.1.5.134 port 43472 [ 3] 0.0-10.0 sec 1.25 MBytes 1.05 Mbits/sec 0.007 ms 0/ 893 (0%) [root@itb4 ~]# ping -c 10 10.1.5.134 PING 10.1.5.134 (10.1.5.134) 56(84) bytes of data. 64 bytes from 10.1.5.134: icmp_seq=1 ttl=64 time=0.309 ms 64 bytes from 10.1.5.134: icmp_seq=2 ttl=64 time=0.285 ms 64 bytes from 10.1.5.134: icmp_seq=3 ttl=64 time=0.313 ms 64 bytes from 10.1.5.134: icmp_seq=4 ttl=64 time=0.221 ms 64 bytes from 10.1.5.134: icmp_seq=5 ttl=64 time=0.348 ms 64 bytes from 10.1.5.134: icmp_seq=6 ttl=64 time=0.311 ms 64 bytes from 10.1.5.134: icmp_seq=7 ttl=64 time=0.342 ms 64 bytes from 10.1.5.134: icmp_seq=8 ttl=64 time=0.296 ms 64 bytes from 10.1.5.134: icmp_seq=9 ttl=64 time=0.212 ms 64 bytes from 10.1.5.134: icmp_seq=10 ttl=64 time=0.304 ms --- 10.1.5.134 ping statistics --- 10 packets transmitted, 10 received, 0% packet loss, time 9000ms rtt min/avg/max/mdev = 0.212/0.294/0.348/0.043 ms [root@itbv-pbs ~]# iperf -c itb4.mwt2.org -r -u ------------------------------------------------------------ Server listening on UDP port 5001 Receiving 1470 byte datagrams UDP buffer size: 126 KByte (default) ------------------------------------------------------------ ------------------------------------------------------------ Client connecting to itb4.mwt2.org, UDP port 5001 Sending 1470 byte datagrams UDP buffer size: 126 KByte (default) ------------------------------------------------------------ [ 5] local 10.1.5.134 port 48498 connected with 10.1.5.102 port 5001 [ ID] Interval Transfer Bandwidth [ 5] 0.0-10.0 sec 1.25 MBytes 1.05 Mbits/sec [ 5] Sent 893 datagrams [ 5] Server Report: [ 5] 0.0-10.0 sec 1.25 MBytes 1.05 Mbits/sec 0.005 ms 0/ 893 (0%) [ 3] local 10.1.5.134 port 5001 connected with 10.1.5.102 port 42952 [ 3] 0.0-10.0 sec 1.25 MBytes 1.05 Mbits/sec 0.010 ms 0/ 893 (0%) [root@itbv-pbs ~]# ping -c 10 itb4.mwt2.org PING itb4.mwt2.org (10.1.5.102) 56(84) bytes of data. 64 bytes from itb4.mwt2.org (10.1.5.102): icmp_seq=1 ttl=64 time=1.53 ms 64 bytes from itb4.mwt2.org (10.1.5.102): icmp_seq=2 ttl=64 time=0.242 ms 64 bytes from itb4.mwt2.org (10.1.5.102): icmp_seq=3 ttl=64 time=0.219 ms 64 bytes from itb4.mwt2.org (10.1.5.102): icmp_seq=4 ttl=64 time=0.215 ms 64 bytes from itb4.mwt2.org (10.1.5.102): icmp_seq=5 ttl=64 time=0.223 ms 64 bytes from itb4.mwt2.org (10.1.5.102): icmp_seq=6 ttl=64 time=0.195 ms 64 bytes from itb4.mwt2.org (10.1.5.102): icmp_seq=7 ttl=64 time=0.243 ms 64 bytes from itb4.mwt2.org (10.1.5.102): icmp_seq=8 ttl=64 time=0.270 ms 64 bytes from itb4.mwt2.org (10.1.5.102): icmp_seq=9 ttl=64 time=0.243 ms 64 bytes from itb4.mwt2.org (10.1.5.102): icmp_seq=10 ttl=64 time=0.238 ms --- itb4.mwt2.org ping statistics --- 10 packets transmitted, 10 received, 0% packet loss, time 9005ms rtt min/avg/max/mdev = 0.195/0.362/1.533/0.390 ms
LVM based VM
When the VM was running as a server and receiving a connection from itb4, itb4 was able to connect at 1.05 Mbits/sec with no loss of datagrams, a latency of 0.274 ms, and a jitter of 0.045 ms (server) / 0.010 ms (client) . When itb4 was running as a server and the VM was a client, it was able to transfer data to itb4 at 1.05 Mbits/sec with no loss of datagrams, a latency of 0.302 ms, and a jitter of 0.008 ms (server) / 0.006 ms (client).[root@itb4 ~]# iperf -c 10.1.5.135 -u -r ------------------------------------------------------------ Server listening on UDP port 5001 Receiving 1470 byte datagrams UDP buffer size: 126 KByte (default) ------------------------------------------------------------ ------------------------------------------------------------ Client connecting to 10.1.5.135, UDP port 5001 Sending 1470 byte datagrams UDP buffer size: 126 KByte (default) ------------------------------------------------------------ [ 4] local 10.1.5.102 port 43740 connected with 10.1.5.135 port 5001 [ ID] Interval Transfer Bandwidth [ 4] 0.0-10.0 sec 1.25 MBytes 1.05 Mbits/sec [ 4] Sent 893 datagrams [ 4] Server Report: [ 4] 0.0-10.0 sec 1.25 MBytes 1.05 Mbits/sec 0.045 ms 0/ 893 (0%) [ 3] local 10.1.5.102 port 5001 connected with 10.1.5.135 port 51783 [ 3] 0.0-10.0 sec 1.25 MBytes 1.05 Mbits/sec 0.010 ms 0/ 893 (0%) [root@itb4 ~]# ping -c 10 10.1.5.135 PING 10.1.5.135 (10.1.5.135) 56(84) bytes of data. 64 bytes from 10.1.5.135: icmp_seq=1 ttl=64 time=0.255 ms 64 bytes from 10.1.5.135: icmp_seq=2 ttl=64 time=0.229 ms 64 bytes from 10.1.5.135: icmp_seq=3 ttl=64 time=0.227 ms 64 bytes from 10.1.5.135: icmp_seq=4 ttl=64 time=0.257 ms 64 bytes from 10.1.5.135: icmp_seq=5 ttl=64 time=0.382 ms 64 bytes from 10.1.5.135: icmp_seq=6 ttl=64 time=0.236 ms 64 bytes from 10.1.5.135: icmp_seq=7 ttl=64 time=0.350 ms 64 bytes from 10.1.5.135: icmp_seq=8 ttl=64 time=0.212 ms 64 bytes from 10.1.5.135: icmp_seq=9 ttl=64 time=0.245 ms 64 bytes from 10.1.5.135: icmp_seq=10 ttl=64 time=0.352 ms --- 10.1.5.135 ping statistics --- 10 packets transmitted, 10 received, 0% packet loss, time 9001ms rtt min/avg/max/mdev = 0.212/0.274/0.382/0.061 ms [root@itbv-condor ~]# iperf -c itb4.mwt2.org -u -r ------------------------------------------------------------ Server listening on UDP port 5001 Receiving 1470 byte datagrams UDP buffer size: 126 KByte (default) ------------------------------------------------------------ ------------------------------------------------------------ Client connecting to itb4.mwt2.org, UDP port 5001 Sending 1470 byte datagrams UDP buffer size: 126 KByte (default) ------------------------------------------------------------ [ 5] local 10.1.5.135 port 50833 connected with 10.1.5.102 port 5001 [ ID] Interval Transfer Bandwidth [ 5] 0.0-10.0 sec 1.25 MBytes 1.05 Mbits/sec [ 5] Sent 893 datagrams [ 5] Server Report: [ 5] 0.0-10.0 sec 1.25 MBytes 1.05 Mbits/sec 0.008 ms 0/ 893 (0%) [ 3] local 10.1.5.135 port 5001 connected with 10.1.5.102 port 46085 [ 3] 0.0-10.0 sec 1.25 MBytes 1.05 Mbits/sec 0.006 ms 0/ 893 (0%) [root@itbv-condor ~]# ping -c 10 itb4.mwt2.org PING itb4.mwt2.org (10.1.5.102) 56(84) bytes of data. 64 bytes from itb4.mwt2.org (10.1.5.102): icmp_seq=1 ttl=64 time=0.350 ms 64 bytes from itb4.mwt2.org (10.1.5.102): icmp_seq=2 ttl=64 time=0.310 ms 64 bytes from itb4.mwt2.org (10.1.5.102): icmp_seq=3 ttl=64 time=0.307 ms 64 bytes from itb4.mwt2.org (10.1.5.102): icmp_seq=4 ttl=64 time=0.392 ms 64 bytes from itb4.mwt2.org (10.1.5.102): icmp_seq=5 ttl=64 time=0.305 ms 64 bytes from itb4.mwt2.org (10.1.5.102): icmp_seq=6 ttl=64 time=0.241 ms 64 bytes from itb4.mwt2.org (10.1.5.102): icmp_seq=7 ttl=64 time=0.307 ms 64 bytes from itb4.mwt2.org (10.1.5.102): icmp_seq=8 ttl=64 time=0.227 ms 64 bytes from itb4.mwt2.org (10.1.5.102): icmp_seq=9 ttl=64 time=0.302 ms 64 bytes from itb4.mwt2.org (10.1.5.102): icmp_seq=10 ttl=64 time=0.285 ms --- itb4.mwt2.org ping statistics --- 10 packets transmitted, 10 received, 0% packet loss, time 9006ms rtt min/avg/max/mdev = 0.227/0.302/0.392/0.048 ms
Simultaneous testing
Running iperf tests on the physical system and a VM results in the latency and jitter to both increasing slightly. The same effect is seen if iperf is run against the two VMs simultaneously.[root@itb4 ~]# ping -c 10 itb-kvm2.mwt2.org PING itb-kvm2.mwt2.org (10.1.4.122) 56(84) bytes of data. 64 bytes from itb-kvm2.mwt2.org (10.1.4.122): icmp_seq=1 ttl=64 time=0.180 ms 64 bytes from itb-kvm2.mwt2.org (10.1.4.122): icmp_seq=2 ttl=64 time=0.170 ms 64 bytes from itb-kvm2.mwt2.org (10.1.4.122): icmp_seq=3 ttl=64 time=0.182 ms 64 bytes from itb-kvm2.mwt2.org (10.1.4.122): icmp_seq=4 ttl=64 time=0.171 ms 64 bytes from itb-kvm2.mwt2.org (10.1.4.122): icmp_seq=5 ttl=64 time=0.171 ms 64 bytes from itb-kvm2.mwt2.org (10.1.4.122): icmp_seq=6 ttl=64 time=0.132 ms 64 bytes from itb-kvm2.mwt2.org (10.1.4.122): icmp_seq=7 ttl=64 time=0.162 ms 64 bytes from itb-kvm2.mwt2.org (10.1.4.122): icmp_seq=8 ttl=64 time=0.170 ms 64 bytes from itb-kvm2.mwt2.org (10.1.4.122): icmp_seq=9 ttl=64 time=0.169 ms 64 bytes from itb-kvm2.mwt2.org (10.1.4.122): icmp_seq=10 ttl=64 time=0.168 ms --- itb-kvm2.mwt2.org ping statistics --- 10 packets transmitted, 10 received, 0% packet loss, time 9001ms rtt min/avg/max/mdev = 0.132/0.167/0.182/0.018 ms [root@itb4 ~]# ping -c 10 10.1.5.135 PING 10.1.5.135 (10.1.5.135) 56(84) bytes of data. 64 bytes from 10.1.5.135: icmp_seq=1 ttl=64 time=0.346 ms 64 bytes from 10.1.5.135: icmp_seq=2 ttl=64 time=0.356 ms 64 bytes from 10.1.5.135: icmp_seq=3 ttl=64 time=0.464 ms 64 bytes from 10.1.5.135: icmp_seq=4 ttl=64 time=0.434 ms 64 bytes from 10.1.5.135: icmp_seq=5 ttl=64 time=0.411 ms 64 bytes from 10.1.5.135: icmp_seq=6 ttl=64 time=0.276 ms 64 bytes from 10.1.5.135: icmp_seq=7 ttl=64 time=0.333 ms 64 bytes from 10.1.5.135: icmp_seq=8 ttl=64 time=0.315 ms 64 bytes from 10.1.5.135: icmp_seq=9 ttl=64 time=0.278 ms 64 bytes from 10.1.5.135: icmp_seq=10 ttl=64 time=0.404 ms --- 10.1.5.135 ping statistics --- 10 packets transmitted, 10 received, 0% packet loss, time 9003ms rtt min/avg/max/mdev = 0.276/0.361/0.464/0.065 ms [root@itb4 ~]# iperf -c itb-kvm2.mwt2.org -r -p 12000 -u ------------------------------------------------------------ Server listening on UDP port 12000 Receiving 1470 byte datagrams UDP buffer size: 126 KByte (default) ------------------------------------------------------------ ------------------------------------------------------------ Client connecting to itb-kvm2.mwt2.org, UDP port 12000 Sending 1470 byte datagrams UDP buffer size: 126 KByte (default) ------------------------------------------------------------ [ 5] local 10.1.5.102 port 56192 connected with 10.1.4.122 port 12000 [ ID] Interval Transfer Bandwidth [ 5] 0.0-10.0 sec 1.25 MBytes 1.05 Mbits/sec [ 5] Sent 893 datagrams [ 5] Server Report: [ 5] 0.0-10.0 sec 1.25 MBytes 1.05 Mbits/sec 0.011 ms 0/ 893 (0%) [ 3] local 10.1.5.102 port 12000 connected with 10.1.4.122 port 48498 [ 3] 0.0-10.0 sec 1.25 MBytes 1.05 Mbits/sec 0.004 ms 0/ 893 (0%) [root@itb4 ~]# iperf -c 10.1.5.135 -u -r ------------------------------------------------------------ Server listening on UDP port 5001 Receiving 1470 byte datagrams UDP buffer size: 126 KByte (default) ------------------------------------------------------------ ------------------------------------------------------------ Client connecting to 10.1.5.135, UDP port 5001 Sending 1470 byte datagrams UDP buffer size: 126 KByte (default) ------------------------------------------------------------ [ 4] local 10.1.5.102 port 54559 connected with 10.1.5.135 port 5001 [ ID] Interval Transfer Bandwidth [ 4] 0.0-10.0 sec 1.25 MBytes 1.05 Mbits/sec [ 4] Sent 893 datagrams [ 4] Server Report: [ 4] 0.0-10.0 sec 1.25 MBytes 1.05 Mbits/sec 0.011 ms 0/ 893 (0%) [ 3] local 10.1.5.102 port 5001 connected with 10.1.5.135 port 57019 [ 3] 0.0-10.0 sec 1.25 MBytes 1.05 Mbits/sec 0.013 ms 0/ 893 (0%) [root@itb4 ~]# ping -c 10 10.1.5.134 PING 10.1.5.134 (10.1.5.134) 56(84) bytes of data. 64 bytes from 10.1.5.134: icmp_seq=1 ttl=64 time=0.374 ms 64 bytes from 10.1.5.134: icmp_seq=2 ttl=64 time=0.310 ms 64 bytes from 10.1.5.134: icmp_seq=3 ttl=64 time=0.348 ms 64 bytes from 10.1.5.134: icmp_seq=4 ttl=64 time=0.286 ms 64 bytes from 10.1.5.134: icmp_seq=5 ttl=64 time=0.408 ms 64 bytes from 10.1.5.134: icmp_seq=6 ttl=64 time=0.352 ms 64 bytes from 10.1.5.134: icmp_seq=7 ttl=64 time=0.424 ms 64 bytes from 10.1.5.134: icmp_seq=8 ttl=64 time=0.205 ms 64 bytes from 10.1.5.134: icmp_seq=9 ttl=64 time=0.449 ms 64 bytes from 10.1.5.134: icmp_seq=10 ttl=64 time=0.302 ms --- 10.1.5.134 ping statistics --- 10 packets transmitted, 10 received, 0% packet loss, time 9003ms rtt min/avg/max/mdev = 0.205/0.345/0.449/0.073 ms [root@itb4 ~]# ping -c 10 10.1.5.135 PING 10.1.5.135 (10.1.5.135) 56(84) bytes of data. 64 bytes from 10.1.5.135: icmp_seq=1 ttl=64 time=0.418 ms 64 bytes from 10.1.5.135: icmp_seq=2 ttl=64 time=0.356 ms 64 bytes from 10.1.5.135: icmp_seq=3 ttl=64 time=0.370 ms 64 bytes from 10.1.5.135: icmp_seq=4 ttl=64 time=0.351 ms 64 bytes from 10.1.5.135: icmp_seq=5 ttl=64 time=0.355 ms 64 bytes from 10.1.5.135: icmp_seq=6 ttl=64 time=0.356 ms 64 bytes from 10.1.5.135: icmp_seq=7 ttl=64 time=0.437 ms 64 bytes from 10.1.5.135: icmp_seq=8 ttl=64 time=0.289 ms 64 bytes from 10.1.5.135: icmp_seq=9 ttl=64 time=0.298 ms 64 bytes from 10.1.5.135: icmp_seq=10 ttl=64 time=0.328 ms --- 10.1.5.135 ping statistics --- 10 packets transmitted, 10 received, 0% packet loss, time 9002ms rtt min/avg/max/mdev = 0.289/0.355/0.437/0.049 ms [root@itb4 ~]# iperf -c 10.1.5.134 -r -p 13000 -u ------------------------------------------------------------ Server listening on UDP port 13000 Receiving 1470 byte datagrams UDP buffer size: 126 KByte (default) ------------------------------------------------------------ ------------------------------------------------------------ Client connecting to 10.1.5.134, UDP port 13000 Sending 1470 byte datagrams UDP buffer size: 126 KByte (default) ------------------------------------------------------------ [ 4] local 10.1.5.102 port 41194 connected with 10.1.5.134 port 13000 [ ID] Interval Transfer Bandwidth [ 4] 0.0-10.0 sec 1.25 MBytes 1.05 Mbits/sec [ 4] Sent 893 datagrams [ 4] Server Report: [ 4] 0.0-10.0 sec 1.25 MBytes 1.05 Mbits/sec 0.019 ms 0/ 893 (0%) [ 3] local 10.1.5.102 port 13000 connected with 10.1.5.134 port 35093 [ 3] 0.0-10.0 sec 1.25 MBytes 1.05 Mbits/sec 0.029 ms 0/ 893 (0%) [root@itb4 ~]# iperf -c 10.1.5.135 -u -r ------------------------------------------------------------ Server listening on UDP port 5001 Receiving 1470 byte datagrams UDP buffer size: 126 KByte (default) ------------------------------------------------------------ ------------------------------------------------------------ Client connecting to 10.1.5.135, UDP port 5001 Sending 1470 byte datagrams UDP buffer size: 126 KByte (default) ------------------------------------------------------------ [ 4] local 10.1.5.102 port 36613 connected with 10.1.5.135 port 5001 [ ID] Interval Transfer Bandwidth [ 4] 0.0-10.0 sec 1.25 MBytes 1.05 Mbits/sec [ 4] Sent 893 datagrams [ 4] Server Report: [ 4] 0.0-10.0 sec 1.25 MBytes 1.05 Mbits/sec 0.023 ms 0/ 893 (0%) [ 3] local 10.1.5.102 port 5001 connected with 10.1.5.135 port 50404 [ 3] 0.0-10.0 sec 1.25 MBytes 1.05 Mbits/sec 0.004 ms 0/ 893 (0%)
Bonnie++ testing
Bonnie++ was run on all three setups using the following invocation:bonnie++ -d directory_location -s 50g -n 10 -u userid -x 10. This ran bonnie++ ten times and the results from all ten runs were averaged to provide the following results:
| System | file_size | putc (KB/s) | putc_cpu (%) | put_block (KB/s) | put_block_cpu (%) | rewrite (KB/s) | rewrite_cpu (%) | getc (KB/s) | getc_cpu (%) | get_block (KB/s) | get_block_cpu (%) | seeks | seeks_cpu (%) |
| physical | 50G | 89724 | 95.8 | 299963.7 | 29.9 | 98354.6 | 9 | 76238.3 | 87.5 | 251975 | 11.8 | 518.17 | 0.3 |
| file based kvm | 50G | 84676.6 | 97.4 | 262163.9 | 39.6 | 70238.6 | 8.3 | 64030 | 85.7 | 177192.9 | 17.4 | 252.46 | 1 |
| lvm based kvm | 50G | 84720.6 | 97.4 | 235093.6 | 26 | 62093.6 | 7.5 | 65655.2 | 86.2 | 165834.5 | 15.3 | 248.76 | 1 |
Iozone testing
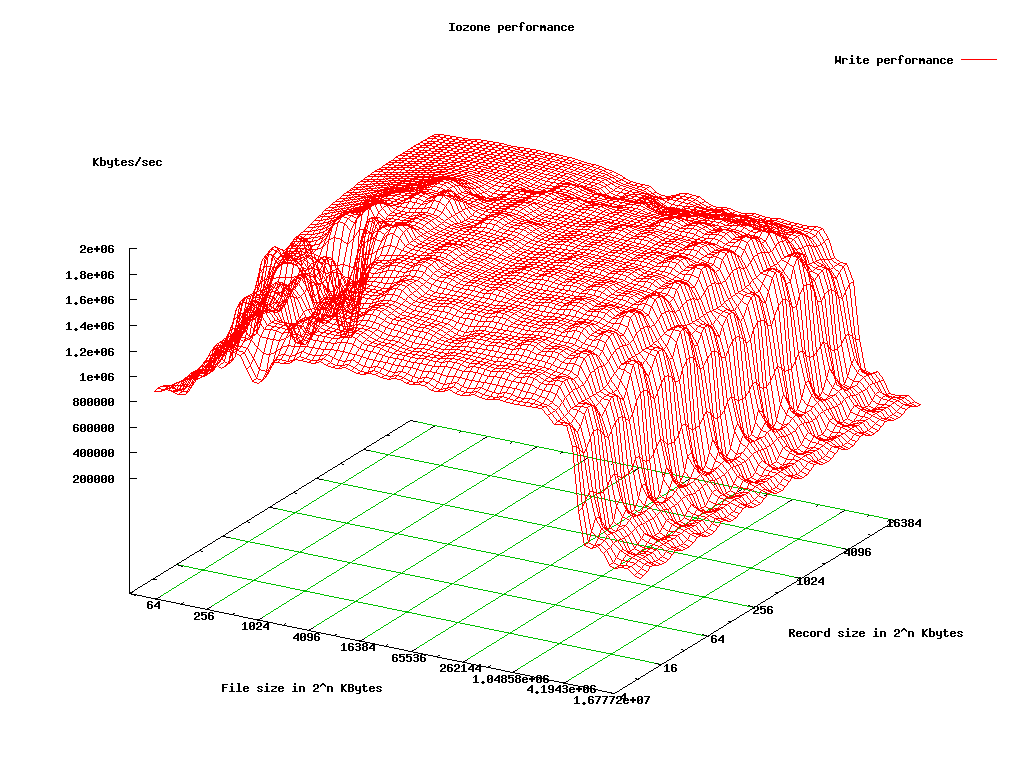
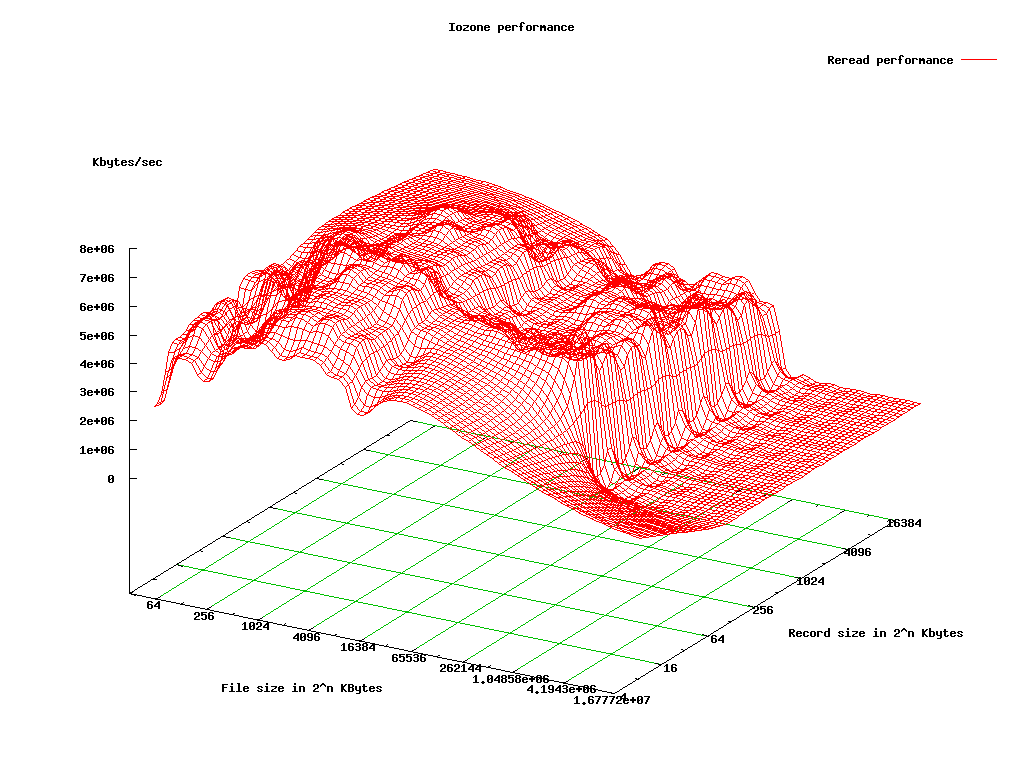
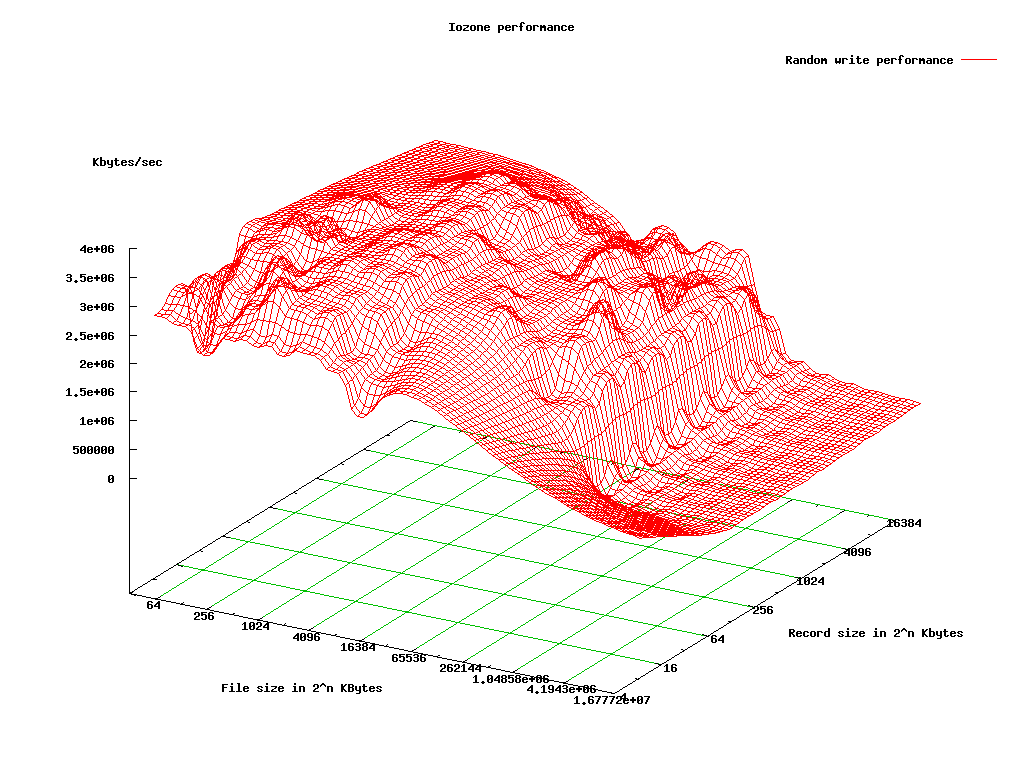
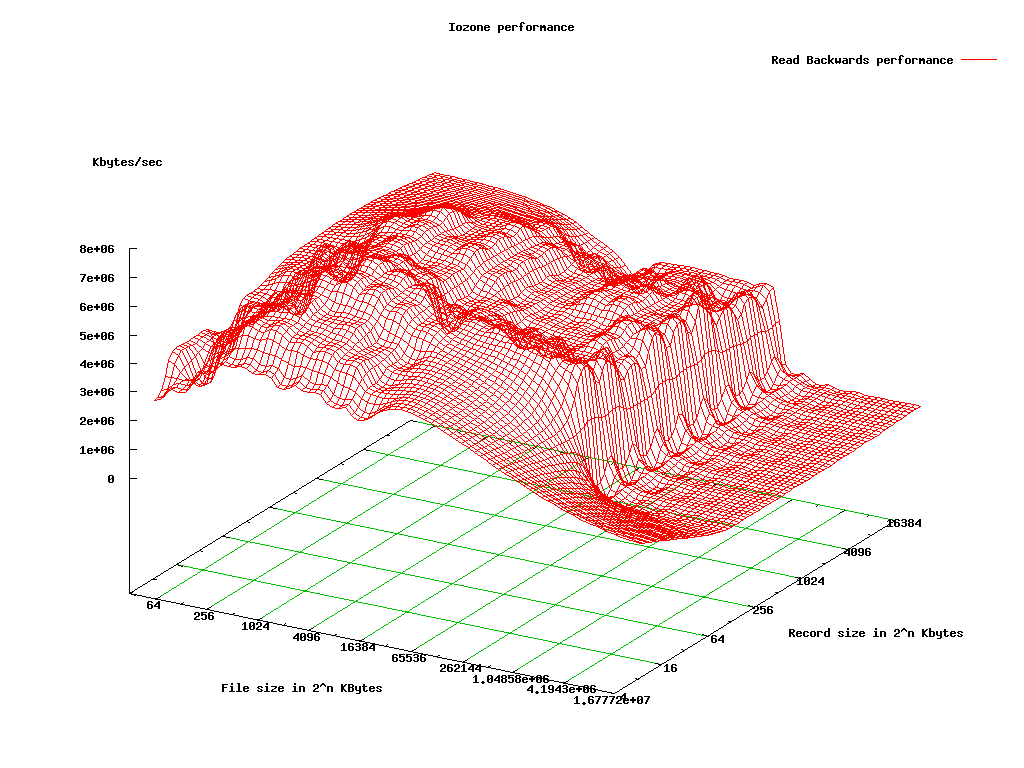
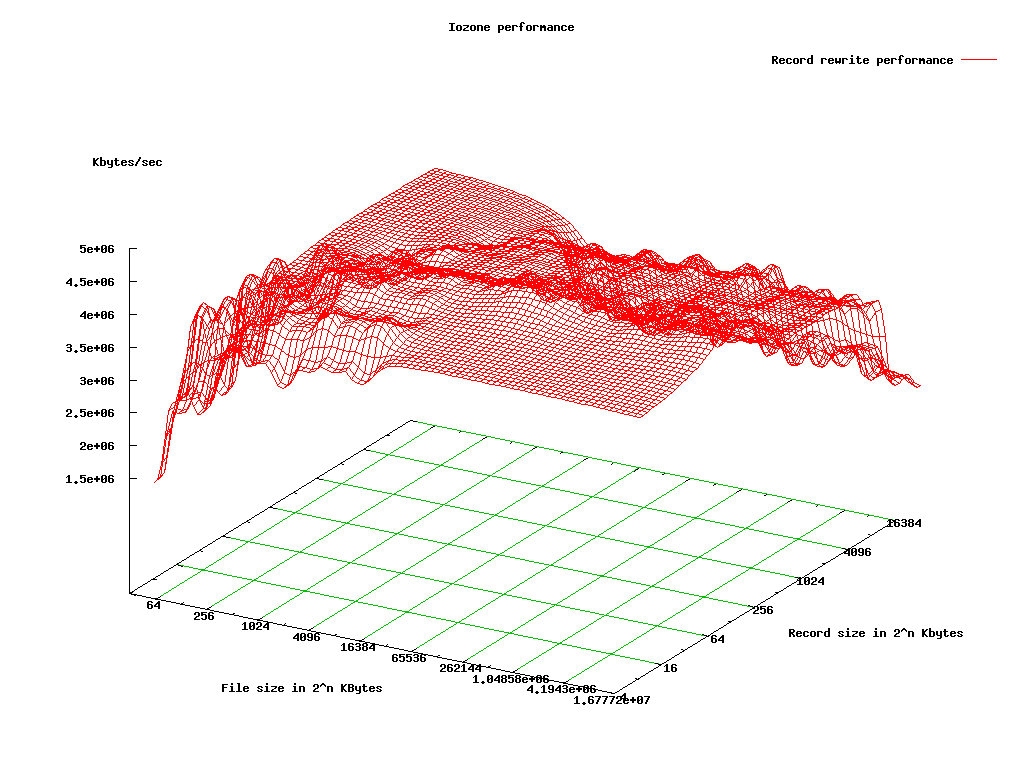
Iozone provides more extensive information on I/O performance for various scenarios. The following invocation was used to run iozone on the physical system:iozone -Raz -g 50G -f /mnt/phys_raid/iozone_test -U /mnt/phys_raid -b iozone_output.wks. The -z option was not used on the VMs due to the increased time required to test small record sizes on large files (~3-4 days extra). Due to this, the graphs of the VM performance will have 0 as values for smaller record sizes once the file size is larger than 32MB.
Iozone test definitions
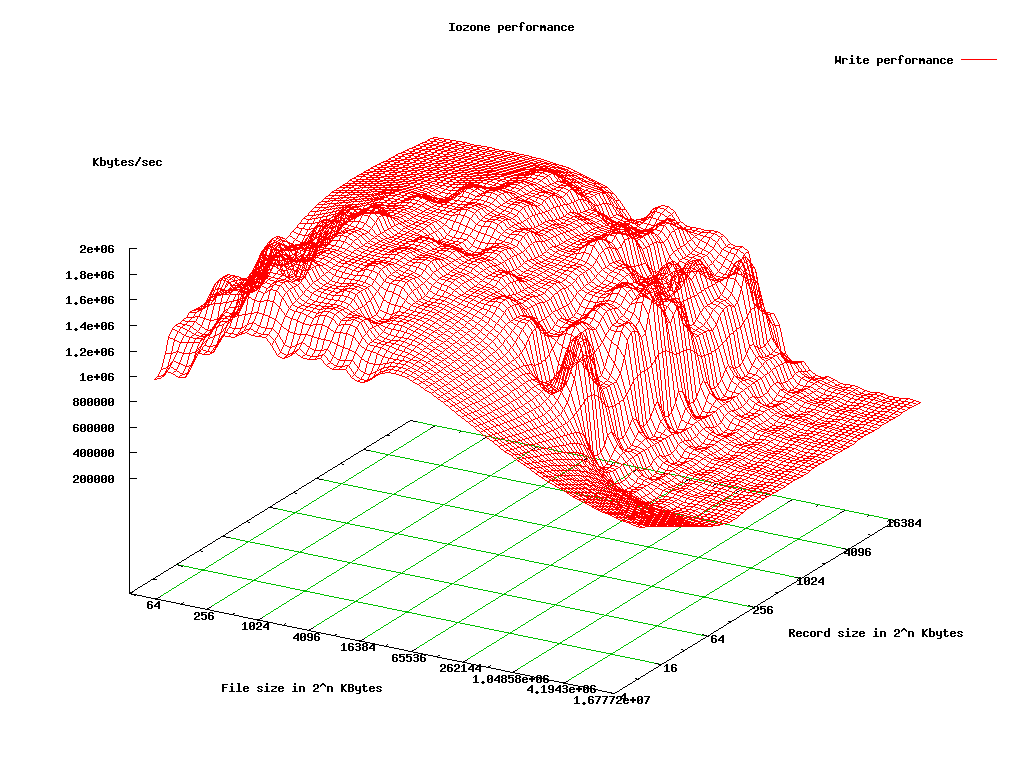
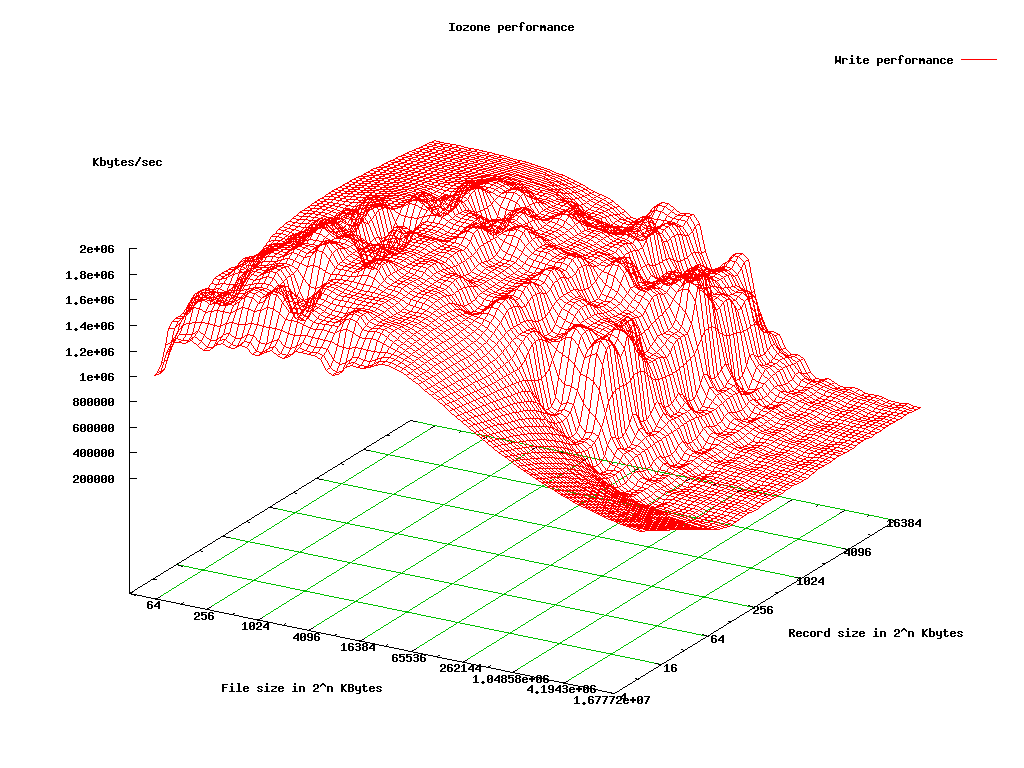
Write
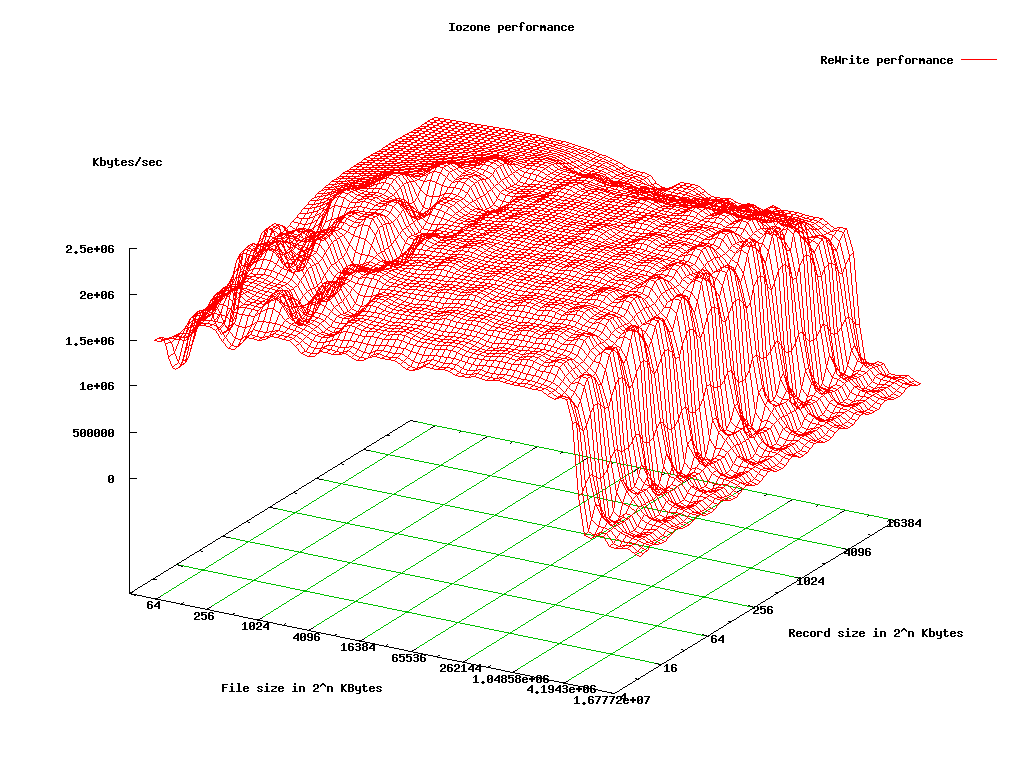
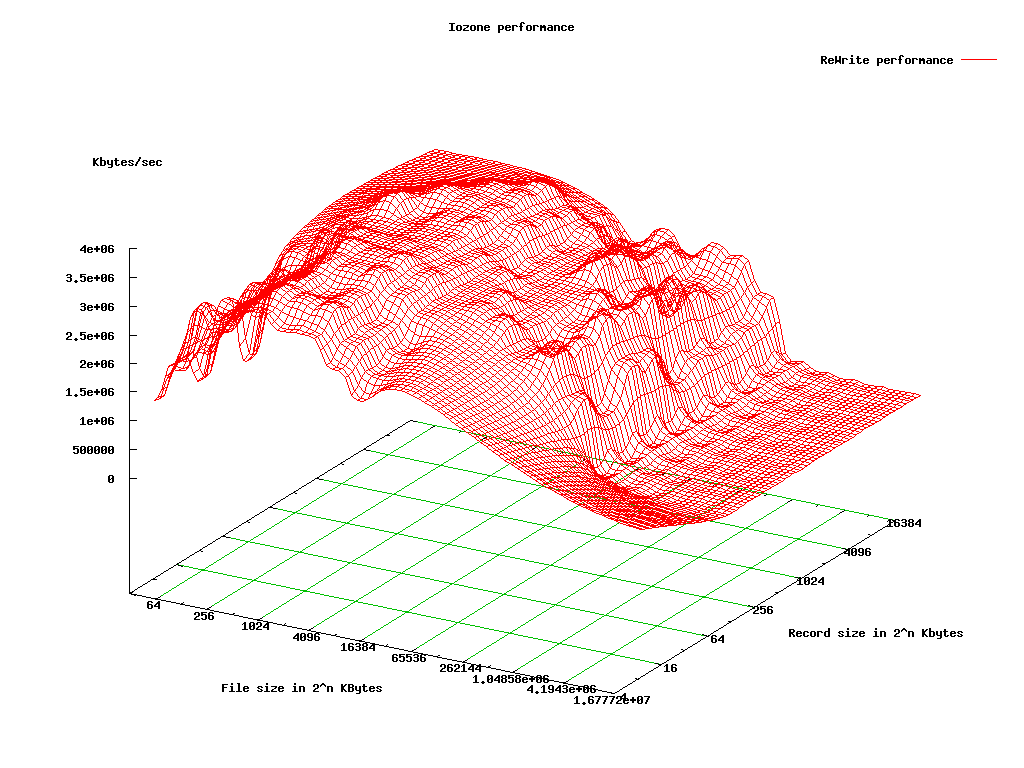
This test measures the performance of writing a new file. When a new file is written not only does the data need to be stored but also the overhead information for keeping track of where the data is located on the storage media. This overhead is called the “metadata” It consists of the directory information, the space allocation and any other data associated with a file that is not part of the data contained in the file. It is normal for the initial write performance to be lower than the performance of re- writing a file due to this overhead information.Re-write
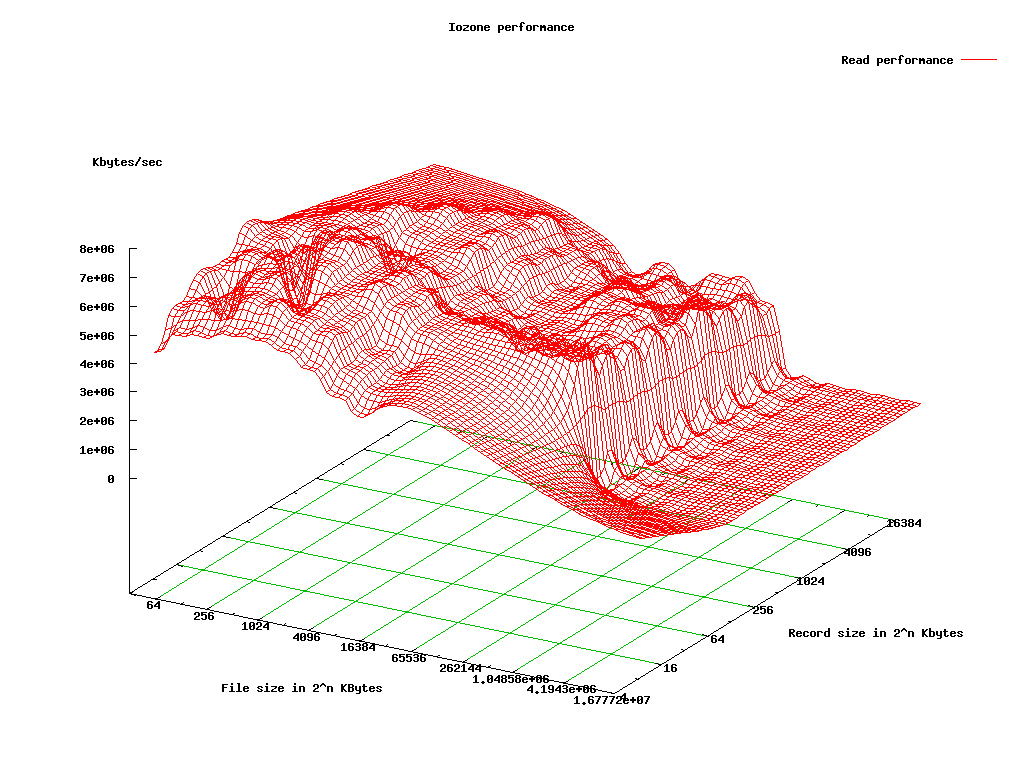
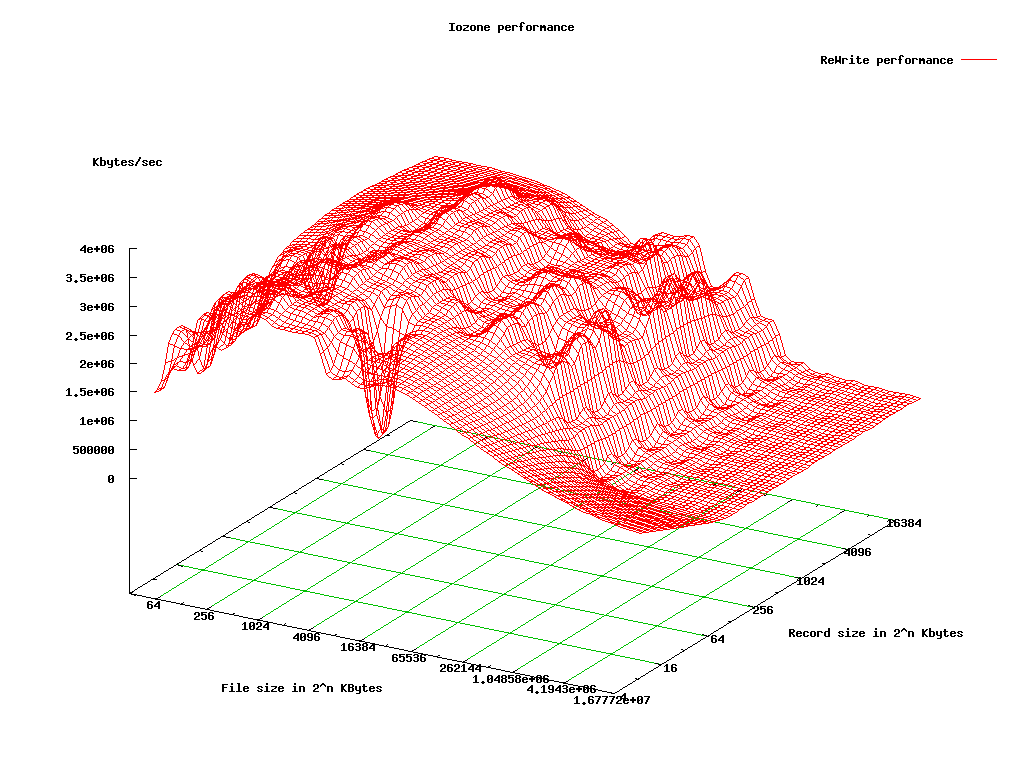
This test measures the performance of writing a file that already exists. When a file is written that already exists the work required is less as the metadata already exists. It is normal for the rewrite performance to be higher than the performance of writing a new file.Read
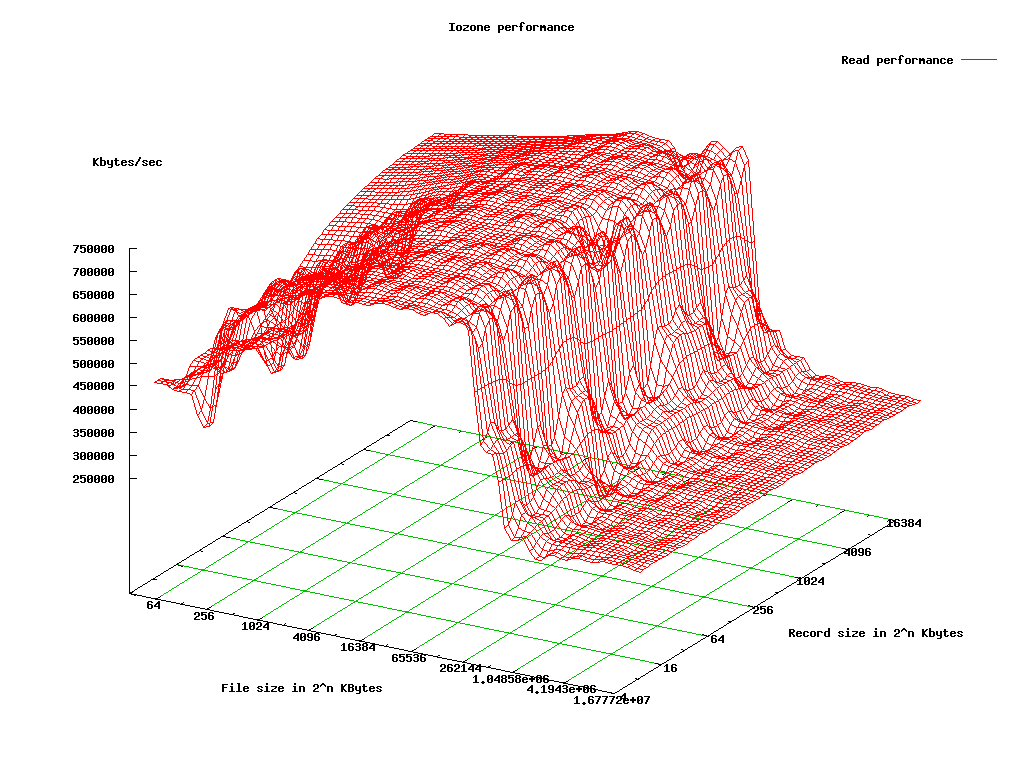
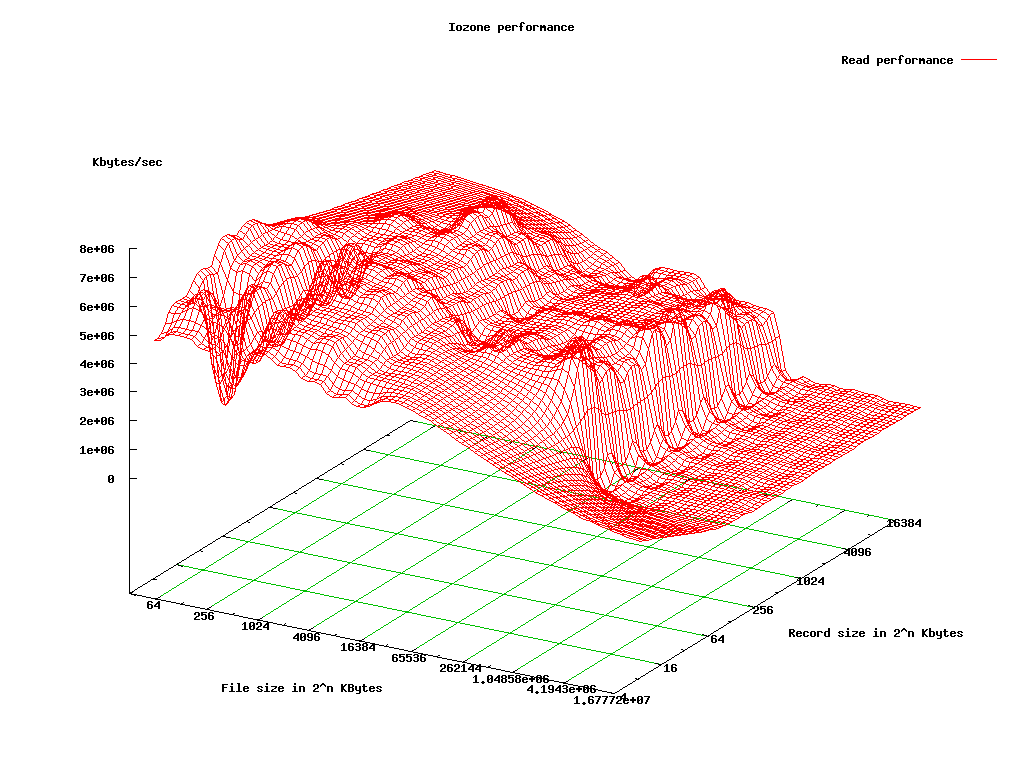
This test measures the performance of reading an existing file.Re-Read
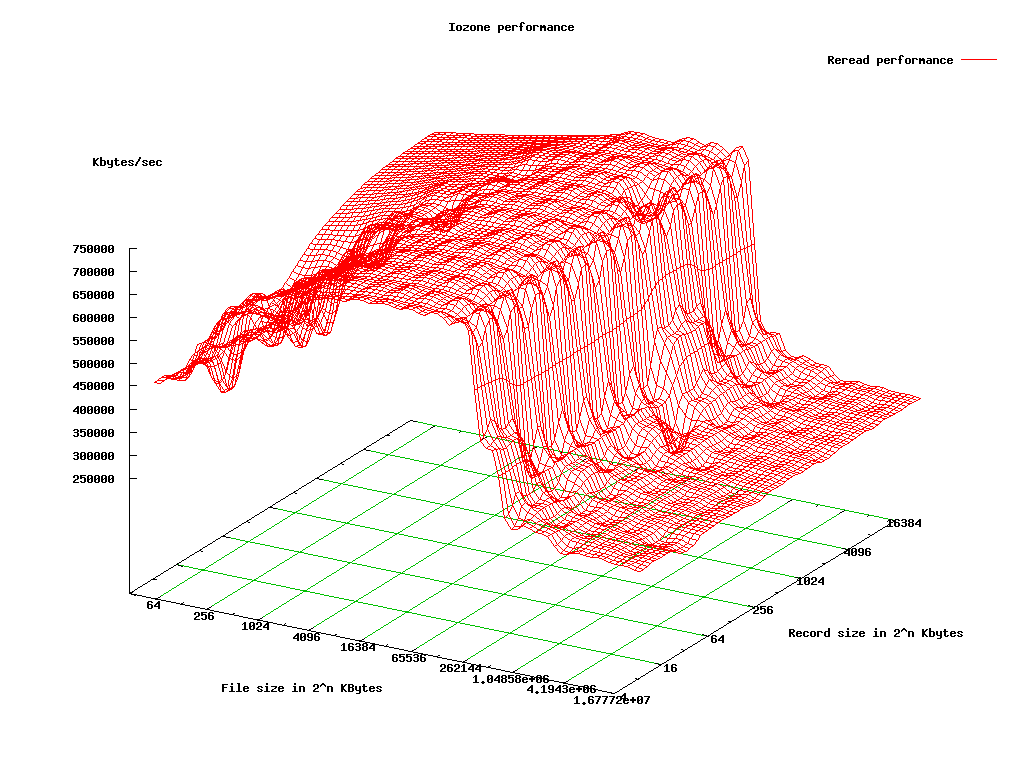
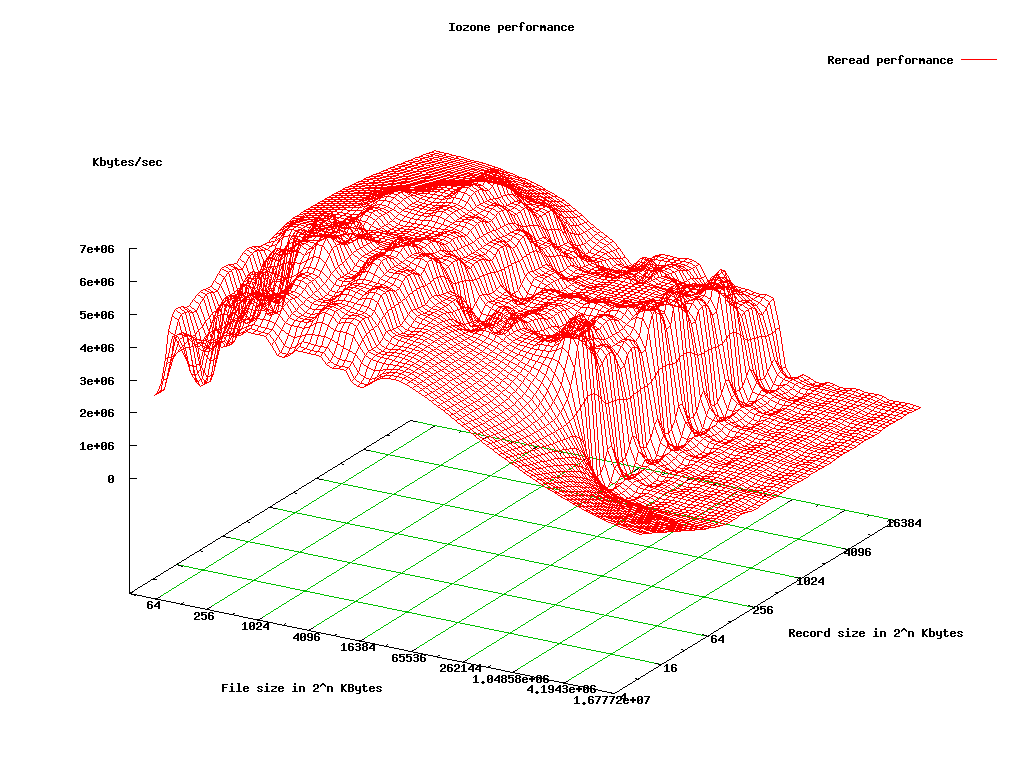
This test measures the performance of reading a file that was recently read. It is normal for the performance to be higher as the operating system generally maintains a cache of the data for files that were recently read. This cache can be used to satisfy reads and improves the performance.Random Read
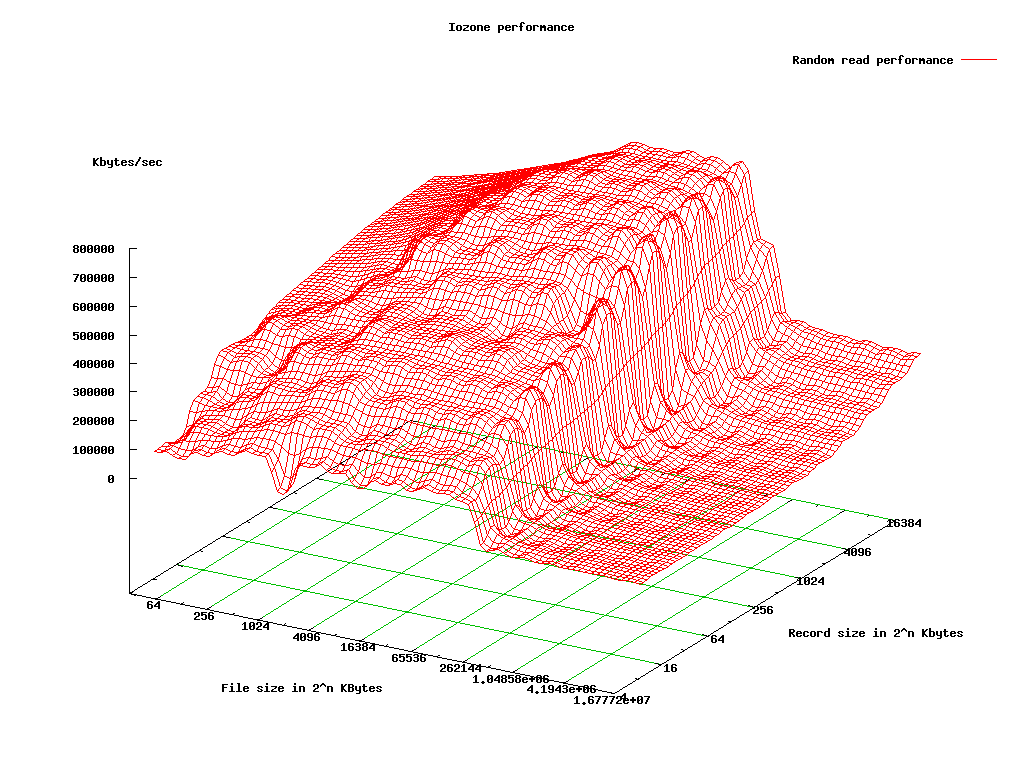
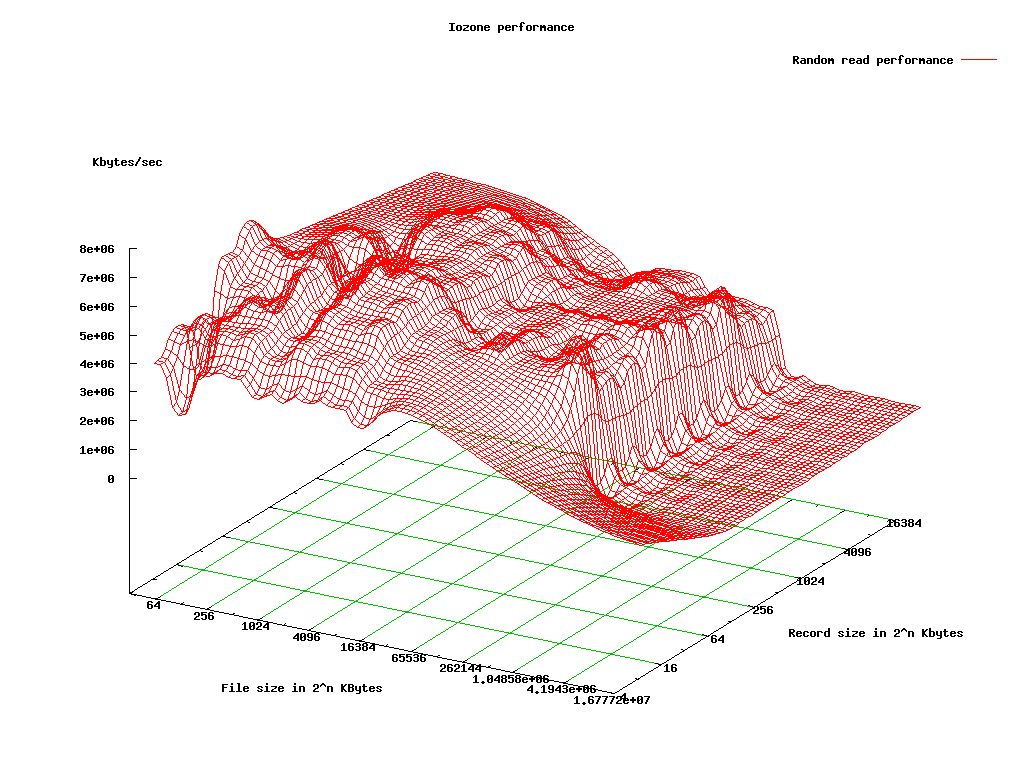
This test measures the performance of reading a file with accesses being made to random locations within the file. The performance of a system under this type of activity can be impacted by several factors such as: Size of operating system’s cache, number of disks, seek latencies, and others.Random Write
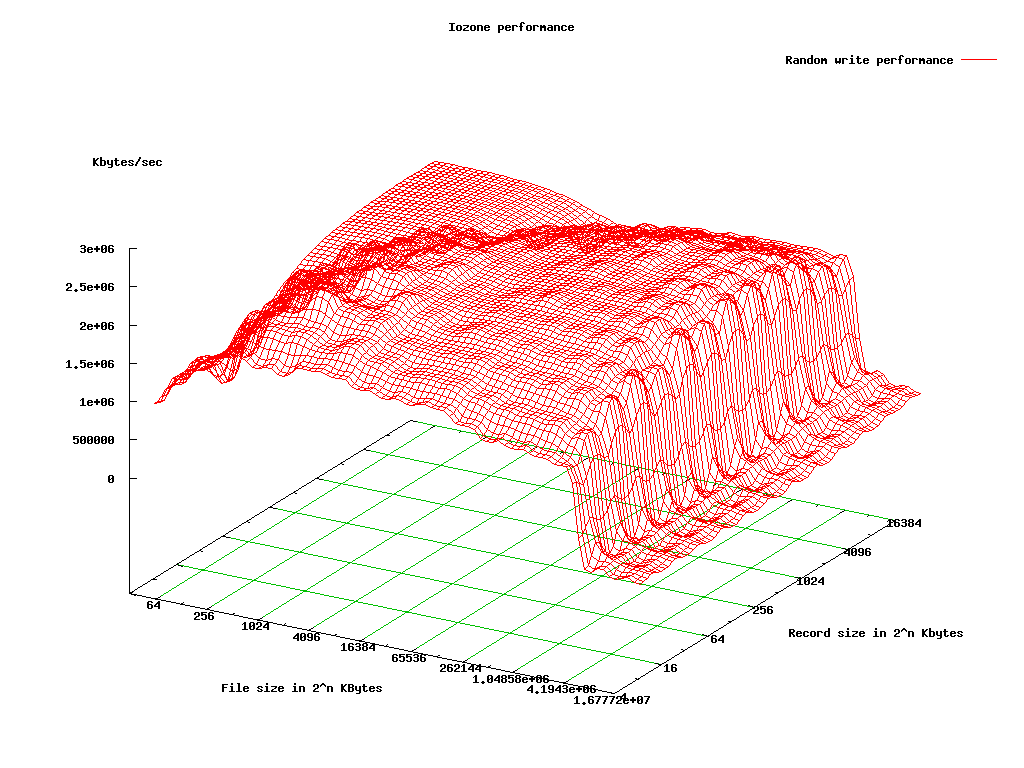
This test measures the performance of writing a file with accesses being made to random locations within the file. Again the performance of a system under this type of activity can be impacted by several factors such as: Size of operating system’s cache, number of disks, seek latencies, and others.Random Mix
This test measures the performance of reading and writing a file with accesses being made to random locations within the file. Again the performance of a system under this type of activity can be impacted by several factors such as: Size of operating system’s cache, number of disks, seek latencies, and others. This test is only available in throughput mode. Each thread/process runs either the read or the write test. The distribution of read/write is done on a round robin basis. More than one thread/process is required for proper operation.Backwards Read
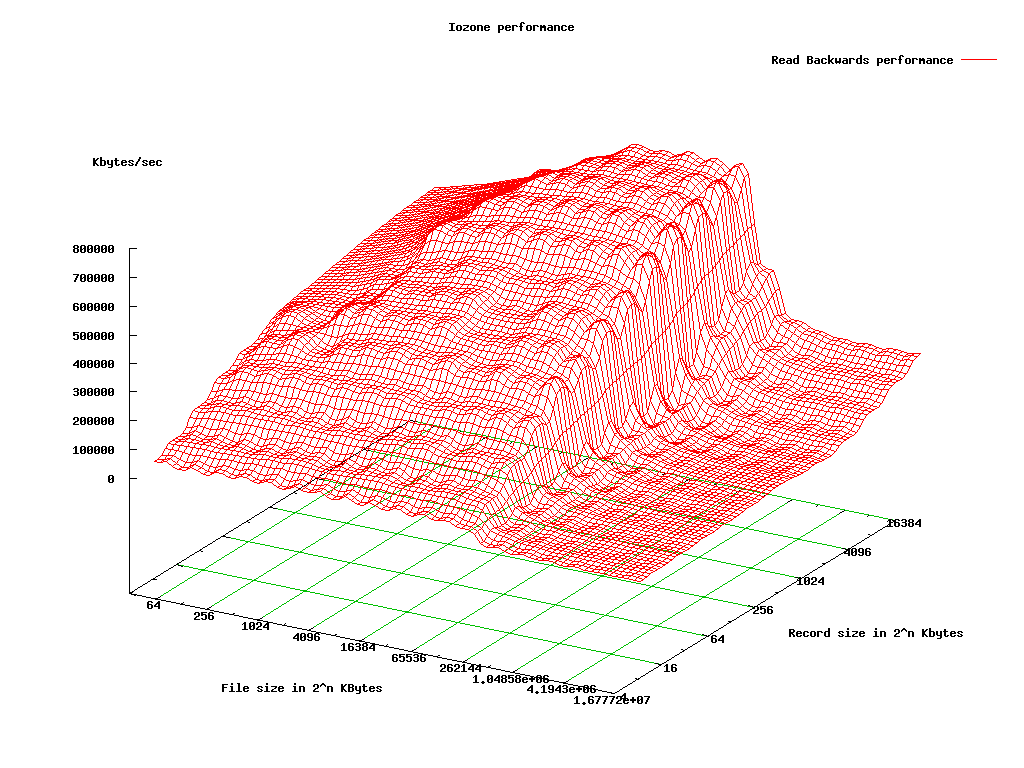
This test measures the performance of reading a file backwards. This may seem like a strange way to read a file but in fact there are applications that do this. MSC Nastran is an example of an application that reads its files backwards. With MSC Nastran, these files are very large (Gbytes to Tbytes in size). Although many operating systems have special features that enable them to read a file forward more rapidly, there are very few operating systems that detect and enhance the performance of reading a file backwards.Record Rewrite
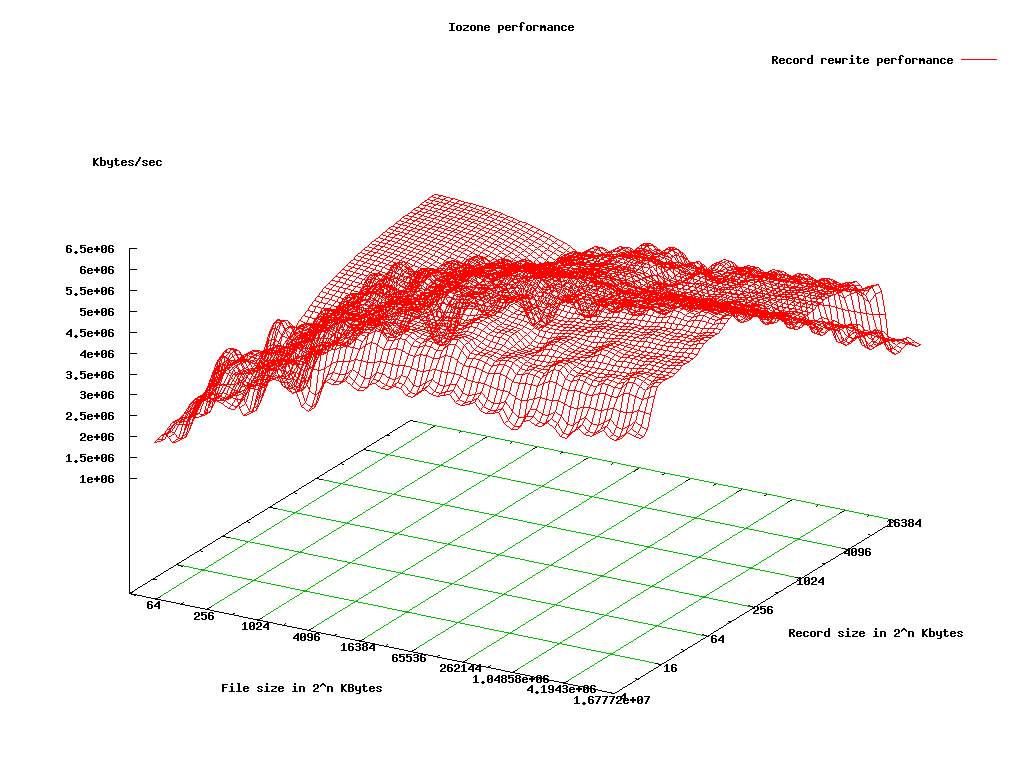
This test measures the performance of writing and re-writing a particular spot within a file. This hot spot can have very interesting behaviors. If the size of the spot is small enough to fit in the CPU data cache then the performance is very high. If the size of the spot is bigger than the CPU data cache but still fits in the TLB then one gets a different level of performance. If the size of the spot is larger than the CPU data cache and larger than the TLB but still fits in the operating system cache then one gets another level of performance, and if the size of the spot is bigger than the operating system cache then one gets yet another level of performance.Strided Read
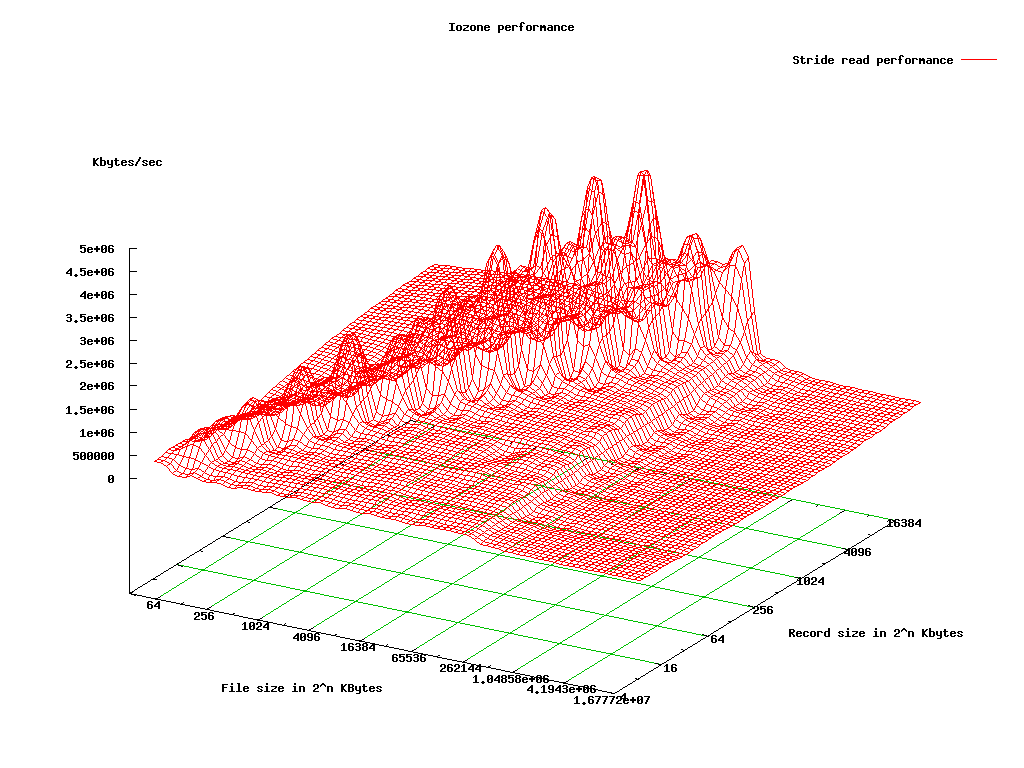
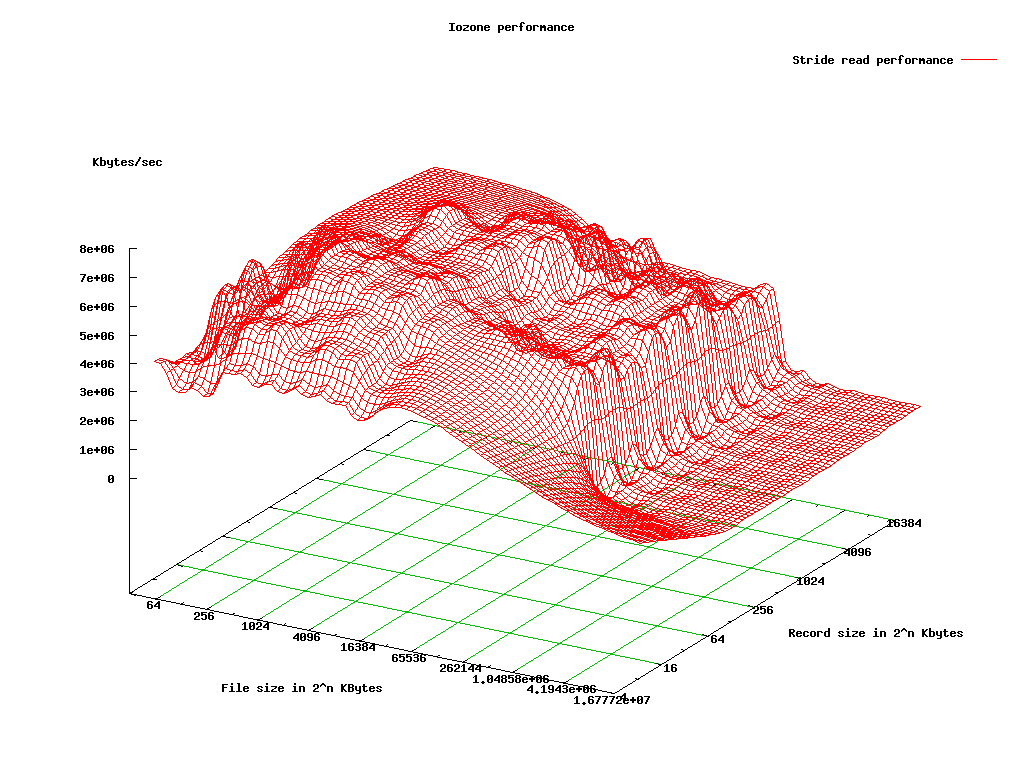
This test measures the performance of reading a file with a strided access behavior. An example would be: Read at offset zero for a length of 4 Kbytes, then seek 200 Kbytes, and then read for a length of 4 Kbytes, then seek 200 Kbytes and so on. Here the pattern is to read 4 Kbytes and then Seek 200 Kbytes and repeat the pattern. This again is a typical application behavior for applications that have data structures contained within a file and is accessing a particular region of the data structure. Most operating systems do not detect this behavior or implement any techniques to enhance the performance under this type of access behavior. This access behavior can also sometimes produce interesting performance anomalies. An example would be if the application’s stride causes a particular disk, in a striped file system, to become the bottleneck.Fwrite
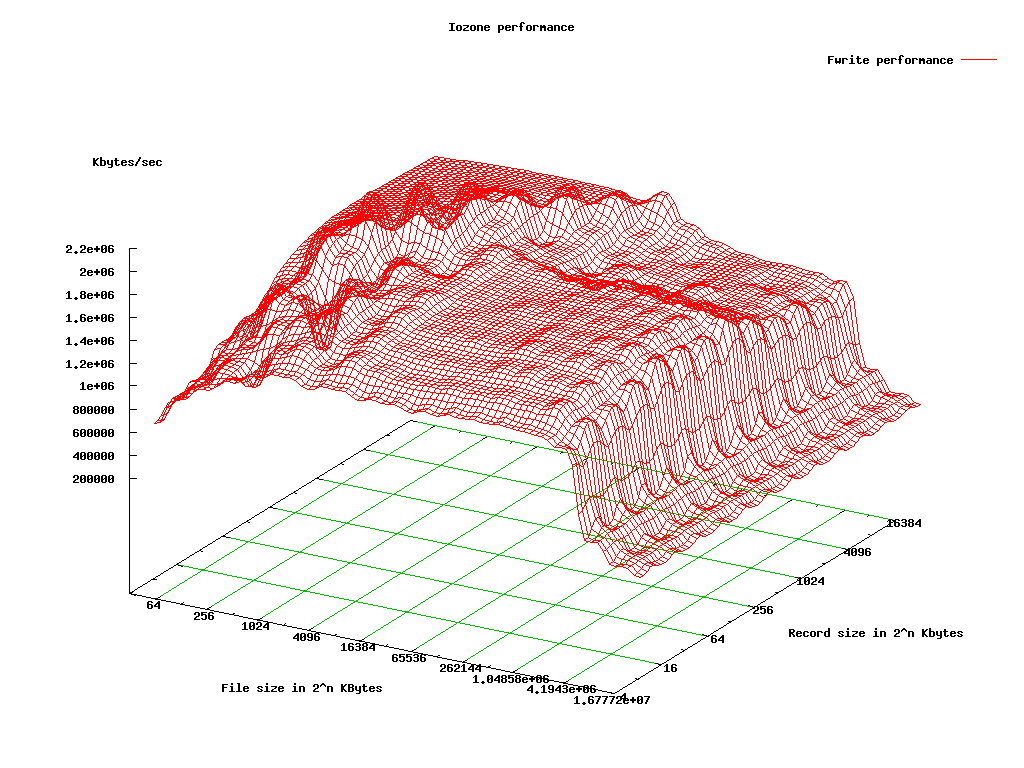
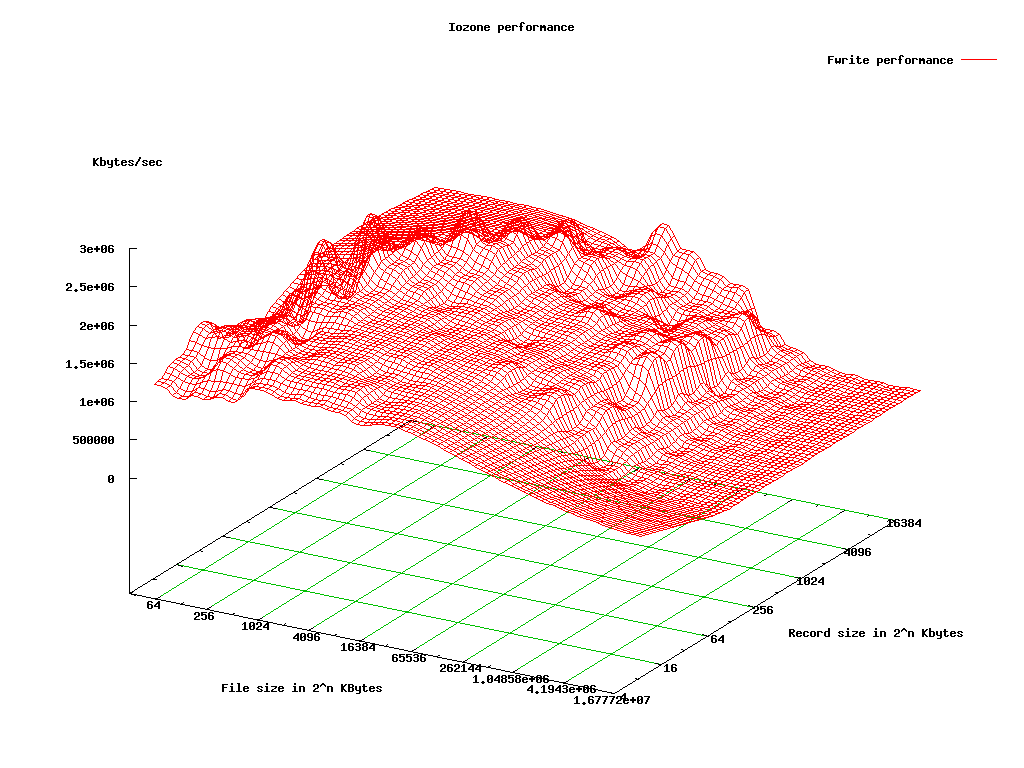
This test measures the performance of writing a file using the library function fwrite(). This is a library routine that performs buffered write operations. The buffer is within the user’s address space. If an application were to write in very small size transfers then the buffered & blocked I/O functionality of fwrite() can enhance the performance of the application by reducing the number of actual operating system calls and increasing the size of the transfers when operating system calls are made. This test is writing a new file so again the overhead of the metadata is included in the measurement.Frewrite
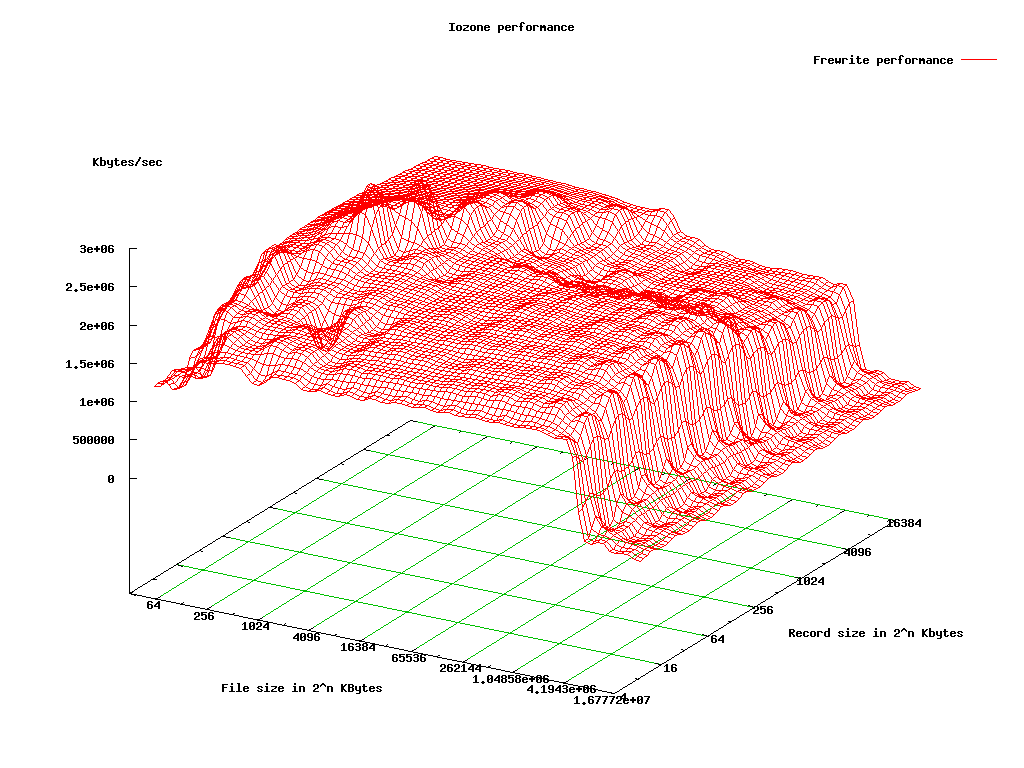
This test measures the performance of writing a file using the library function fwrite(). This is a library routine that performs buffered & blocked write operations. The buffer is within the user’s address space. If an application were to write in very small size transfers then the buffered & blocked I/O functionality of fwrite() can enhance the performance of the application by reducing the number of actual operating system calls and increasing the size of the transfers when operating system calls are made. This test is writing to an existing file so the performance should be higher as there are no metadata operations required.Fread
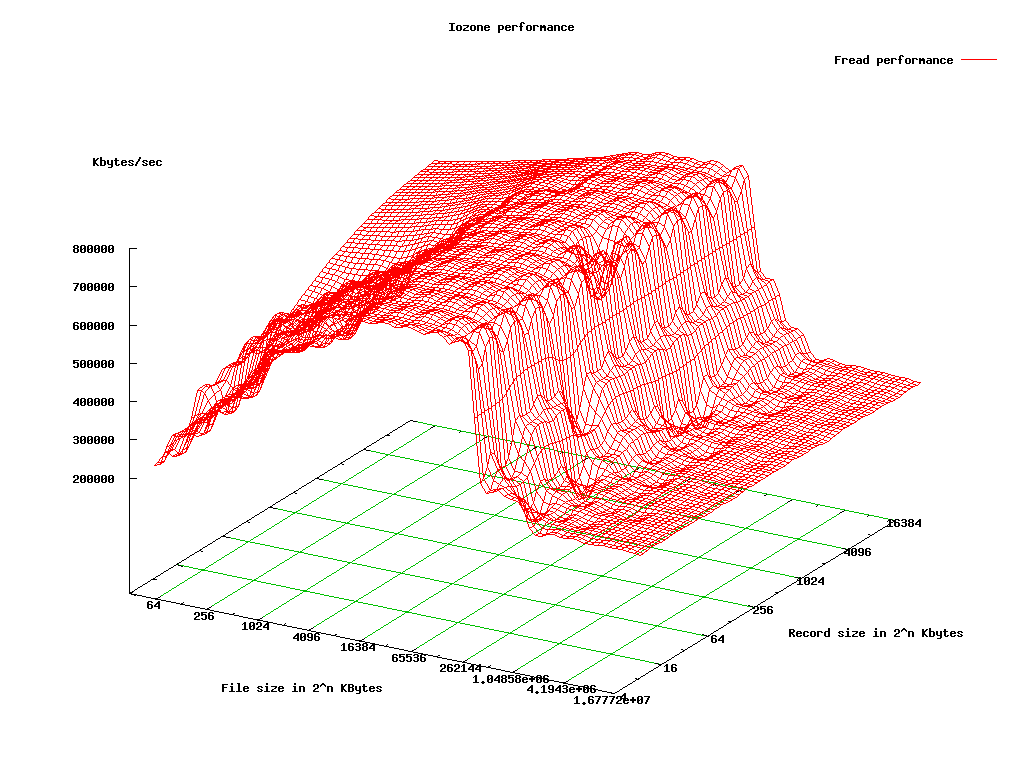
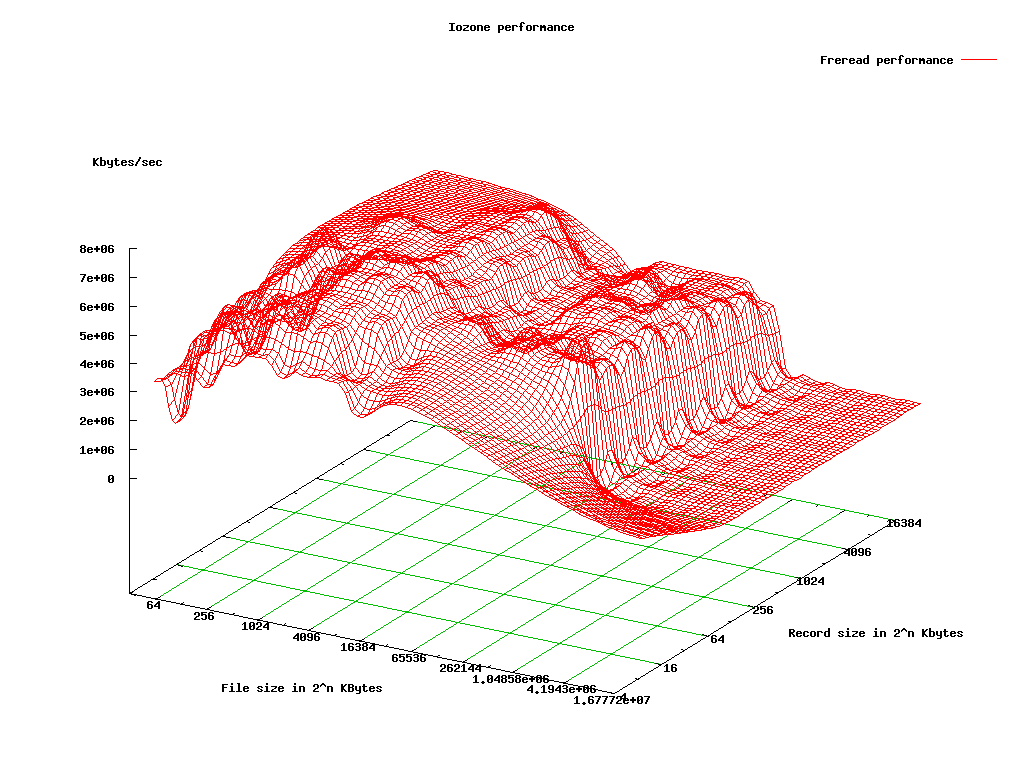
This test measures the performance of reading a file using the library function fread(). This is a library routine that performs buffered & blocked read operations. The buffer is within the user’s address space. If an application were to read in very small size transfers then the buffered & blocked I/O functionality of fread() can enhance the performance of the application by reducing the number of actual operating system calls and increasing the size of the transfers when operating system calls are made.Freread
This test is the same as fread above except that in this test the file that is being read was read in the recent past. This should result in higher performance as the operating system is likely to have the file data in cache.Physical machine
Physical Write
Physical Re-write
Physical Read
Physical Re-Read
Physical Random Read
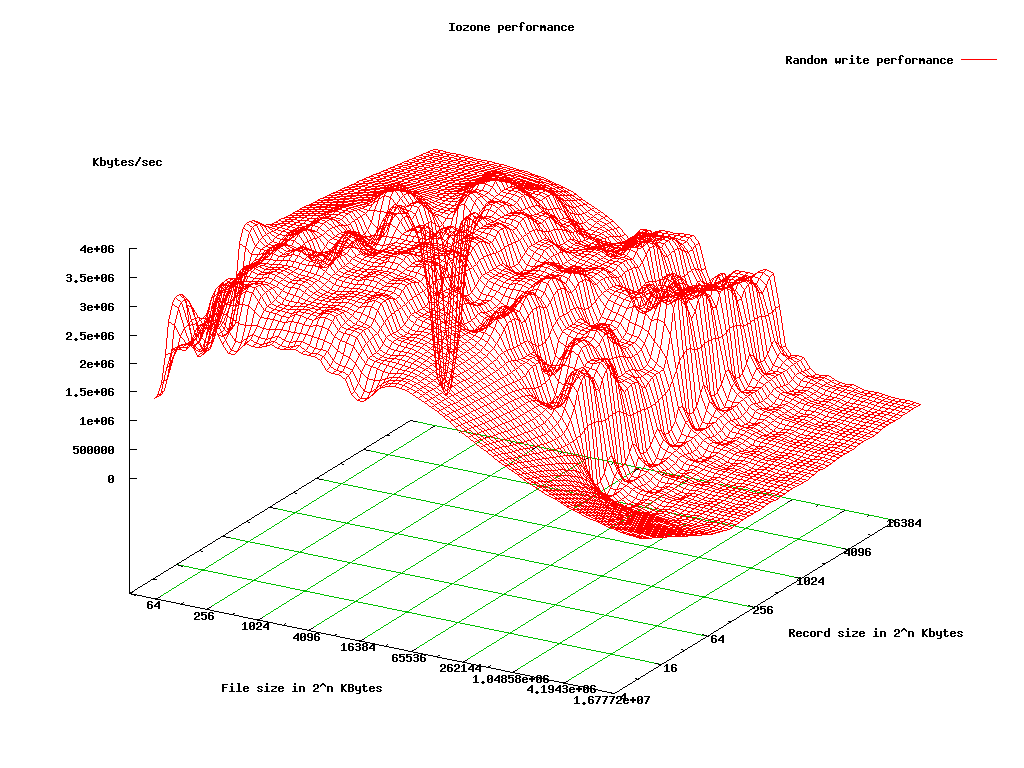
Physical Random Write
Physical Backwards Read
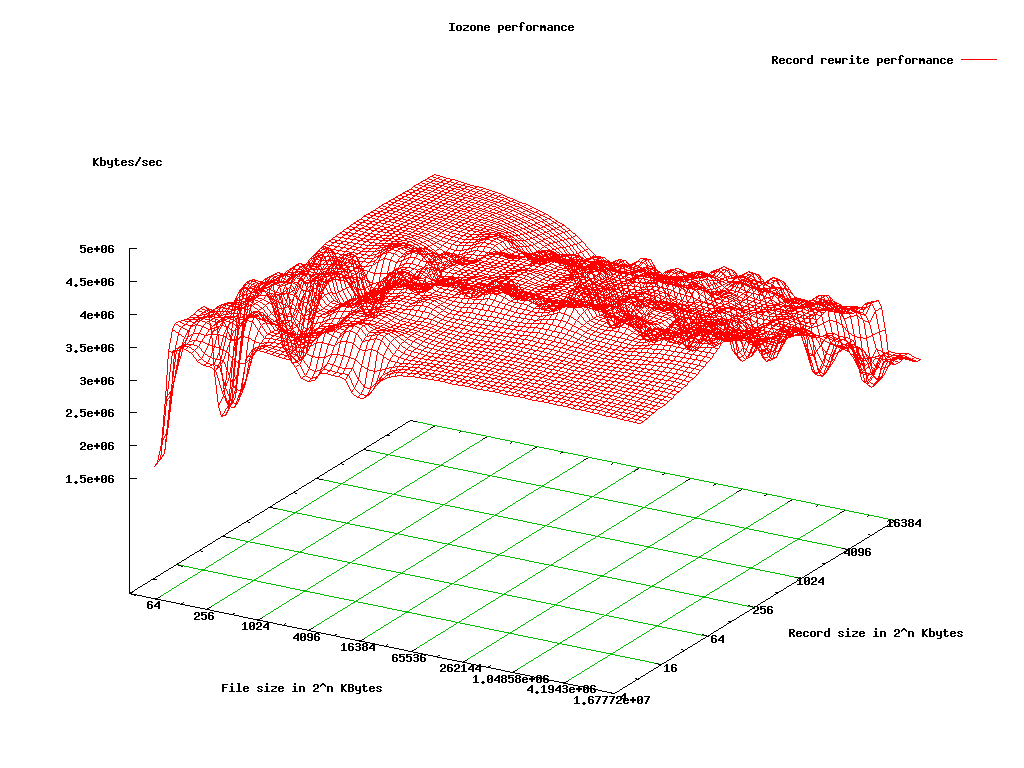
Physical Record Rewrite
Physical Strided Read
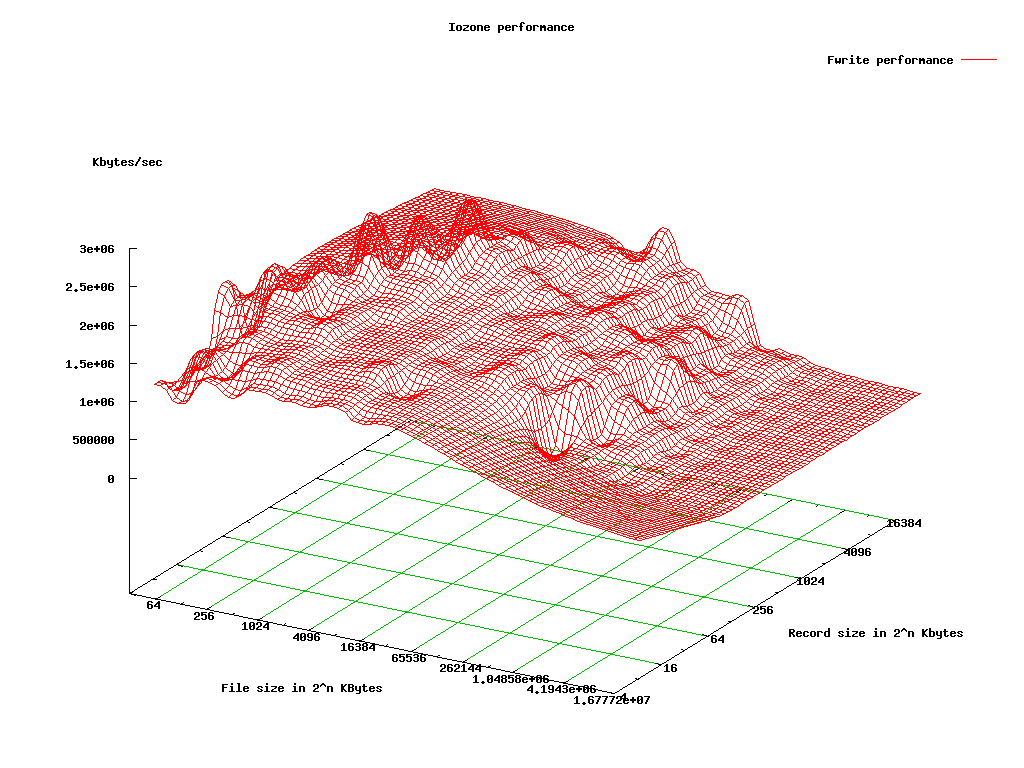
Physical Fwrite
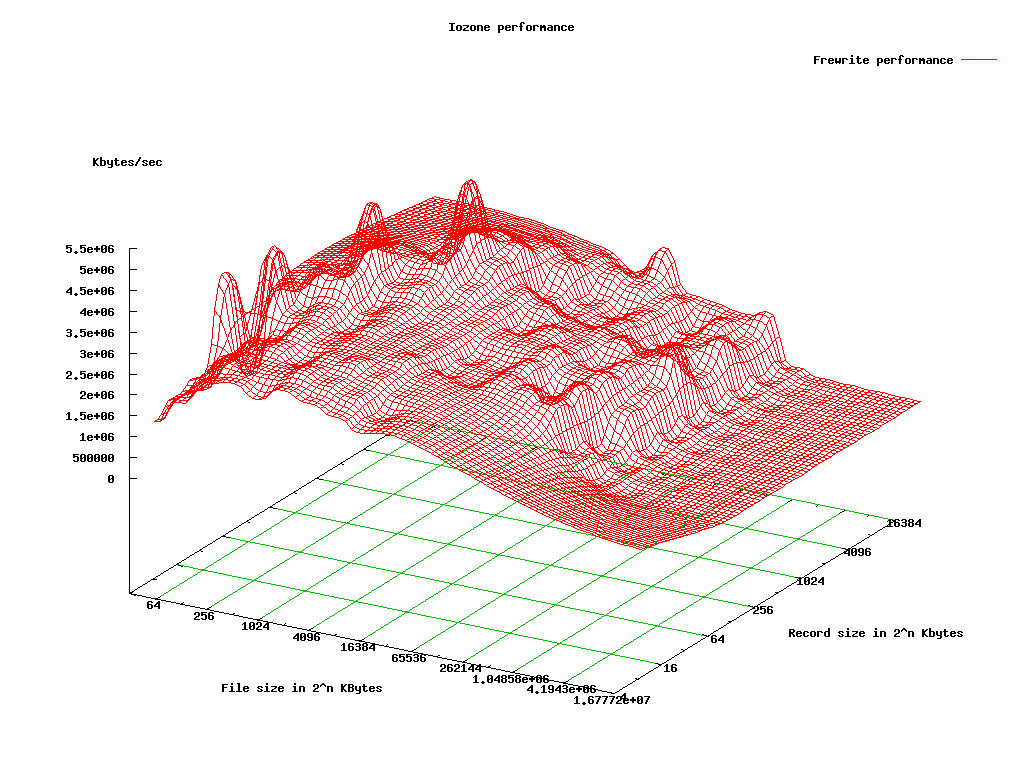
Physical Frewrite
Physical Fread
Physical Freread
File based VM
File based VM Write
File based KVM Re-write
File based VM Read
File based VM Re-Read
File based VM Random Read

File based VM Random Write
File based VM Backwards Read
File based VM Record Rewrite
File based VM Strided Read
File based VM Fwrite
File based VM Frewrite
File based VM Fread

File based VM Freread
LVM based VM
LVM based VM Write
LVM based VM Re-write
LVM based VM Read
LVM based VM Re-Read
LVM based VM Random Read
LVM based VM Random Write
LVM based VM Backwards Read

LVM based VM Record Rewrite
LVM based VM Strided Read

LVM based VM Fwrite
LVM based VM Frewrite
LVM based VM Fread

LVM based VM Freread
Conclusions
There's a significant hit in performance when going from a physical machine to a virtual machine. The performance difference seems to to be on the order of 10% - 20% depending on the exact test and whether the comparison is with the file based or lvm based VM. In some instances however, the VMs had better IO performance although this is primarily with small record sizes and small files. This is probably due to IO being cached or buffered by the host OS. Comparing the file and LVM based VMs, the file based VM consistently do about 5% - 10% better. This is contrary to information on the web but may be due to overhead due to LVM or some other unknown factors. The bonnie results seem to suggest that LVM based VMs use less cpu time for some tests but due to the nature of the virtualized cpu, this may just be random variation. For IO performance, it appears that using file based VMs is the preferred approach.References
- performance_testing_kvm_vs_physical.xlsx: Raw IO testing data
- IOzone_msword_98.pdf: Iozone reference documentation


| I | Attachment | Action | Size | Date | Who | Comment |
|---|---|---|---|---|---|---|
| |
IOzone_msword_98.pdf | manage | 166 K | 09 Feb 2011 - 21:14 | SuchandraThapa | Iozone reference documentation |
| |
bkwdread.png | manage | 36 K | 09 Feb 2011 - 20:48 | SuchandraThapa | Physical Machine backward read performance |
| |
file_bkwdread.png | manage | 31 K | 09 Feb 2011 - 20:50 | SuchandraThapa | File based KVM backward read performance |
| |
file_fread.png | manage | 31 K | 09 Feb 2011 - 20:50 | SuchandraThapa | File based KVM fread performance |
| |
file_freread.png | manage | 31 K | 09 Feb 2011 - 20:50 | SuchandraThapa | File based KVM re-fread performance |
| |
file_frewrite.png | manage | 30 K | 09 Feb 2011 - 20:50 | SuchandraThapa | File based KVM re-fwrite performance |
| |
file_fwrite.png | manage | 30 K | 09 Feb 2011 - 20:51 | SuchandraThapa | File based KVM fwrite performance |
| |
file_randread.png | manage | 32 K | 09 Feb 2011 - 20:51 | SuchandraThapa | File based KVM random read performance |
| |
file_randwrite.png | manage | 33 K | 09 Feb 2011 - 20:51 | SuchandraThapa | File based KVM random write performance |
| |
file_read.png | manage | 31 K | 09 Feb 2011 - 20:52 | SuchandraThapa | File based KVM read performance |
| |
file_recrewrite.png | manage | 24 K | 09 Feb 2011 - 20:52 | SuchandraThapa | File based KVM record rewrite performance |
| |
file_reread.png | manage | 30 K | 09 Feb 2011 - 20:52 | SuchandraThapa | File based KVM re-read performance |
| |
file_rewrite.png | manage | 31 K | 09 Feb 2011 - 20:53 | SuchandraThapa | File based KVM re-write performance |
| |
file_strideread.png | manage | 32 K | 09 Feb 2011 - 20:53 | SuchandraThapa | File based KVM stride read performance |
| |
file_write.png | manage | 32 K | 09 Feb 2011 - 20:53 | SuchandraThapa | File based KVM write performance |
| |
fread.png | manage | 31 K | 09 Feb 2011 - 20:48 | SuchandraThapa | Physical Machine fread performance |
| |
freread.png | manage | 33 K | 09 Feb 2011 - 20:39 | SuchandraThapa | Physical Machine re-fread performance |
| |
frewrite.png | manage | 32 K | 09 Feb 2011 - 20:39 | SuchandraThapa | Physical Machine re-fwrite performance |
| |
fwrite.png | manage | 33 K | 09 Feb 2011 - 20:40 | SuchandraThapa | Physical Machine fwrite performance |
| |
lvm_bkwdread.png | manage | 31 K | 09 Feb 2011 - 20:58 | SuchandraThapa | LVM based KVM backward read performance |
| |
lvm_fread.png | manage | 31 K | 09 Feb 2011 - 20:58 | SuchandraThapa | LVM based KVM fread performance |
| |
lvm_freread.png | manage | 32 K | 09 Feb 2011 - 20:59 | SuchandraThapa | LVM based KVM re-fread performance |
| |
lvm_frewrite.png | manage | 31 K | 09 Feb 2011 - 20:59 | SuchandraThapa | LVM based KVM re-fwrite performance |
| |
lvm_fwrite.png | manage | 31 K | 09 Feb 2011 - 21:00 | SuchandraThapa | LVM based KVM fwrite performance |
| |
lvm_randread.png | manage | 32 K | 09 Feb 2011 - 21:00 | SuchandraThapa | LVM based KVM random read performance |
| |
lvm_randwrite.png | manage | 33 K | 09 Feb 2011 - 21:00 | SuchandraThapa | LVM based KVM random write performance |
| |
lvm_read.png | manage | 31 K | 09 Feb 2011 - 21:00 | SuchandraThapa | LVM based KVM read performance |
| |
lvm_recrewrite.png | manage | 24 K | 09 Feb 2011 - 21:01 | SuchandraThapa | LVM based KVM record rewrite performance |
| |
lvm_reread.png | manage | 31 K | 09 Feb 2011 - 21:01 | SuchandraThapa | LVM based KVM re-read performance |
| |
lvm_rewrite.png | manage | 31 K | 09 Feb 2011 - 21:01 | SuchandraThapa | LVM based KVM re-write performance |
| |
lvm_strideread.png | manage | 31 K | 09 Feb 2011 - 21:02 | SuchandraThapa | LVM based KVM stride read performance |
| |
lvm_write.png | manage | 32 K | 09 Feb 2011 - 21:02 | SuchandraThapa | LVM based KVM write performance |
| |
performance_testing_kvm_vs_physical.xlsx | manage | 237 K | 09 Feb 2011 - 21:10 | SuchandraThapa | Raw IO testing data |
| |
randread.png | manage | 37 K | 09 Feb 2011 - 20:37 | SuchandraThapa | Physical Machine random read performance |
| |
randwrite.png | manage | 32 K | 09 Feb 2011 - 20:38 | SuchandraThapa | Physical Machine random write performance |
| |
read.png | manage | 33 K | 09 Feb 2011 - 20:36 | SuchandraThapa | Physical Machine read performance |
| |
recrewrite.png | manage | 23 K | 09 Feb 2011 - 20:37 | SuchandraThapa | Physical Machine record rewrite performance |
| |
reread.png | manage | 33 K | 09 Feb 2011 - 20:36 | SuchandraThapa | Physical Machine reread performance |
| |
rewrite.png | manage | 33 K | 09 Feb 2011 - 20:36 | SuchandraThapa | Physical Machine rewrite performance |
| |
strideread.png | manage | 31 K | 09 Feb 2011 - 20:38 | SuchandraThapa | Physical Machine stride read performance |
| |
write.png | manage | 34 K | 09 Feb 2011 - 20:34 | SuchandraThapa | Physical Machine write performance |
Edit | Attach | Print version | History: r2 < r1 | Backlinks | View wiki text | Edit wiki text | More topic actions
Topic revision: r2 - 10 Feb 2011, SuchandraThapa
Ideas, requests, problems regarding Foswiki? Send feedback