|
|
You are here: Foswiki>Main Web>GridFTPCapacityTest20080501 (06 May 2008, CharlesWaldman)Edit Attach
Objective
Move 1TB of data between MWT2 sites, measure throughput, test robustness, and measure impact on CPU usage and system loads.Method
100 worker nodes were used as data senders. 1GB test files were prepared viadd if=/dev/zero of=/scratch/test/1GBThis was done using the local utility
dcmd.sh on 100 nodes in parallel.
The worker nodes were then set to copy the file to the gridftp door on
iut2-dc1.iu.edu, 10 times. The exact command was:
dcmd.sh --timeout=100000 '. /share/wn-client/setup.sh;
 export X509_USER_PROXY=~cgw/x509.pem; for x in {0..9}; do
 time globus-url-copy file:///scratch/test/1GB
    gsiftp://iut2-dc1.iu.edu/pnfs/iu.edu/test/1GB-`hostname`-0501-$x;
 done ' c[080] c[081-101]
(uct2-c081 was unavailable at the time)
On the receiving end, the system loads and input were measured using iostat, vmstat, and
ifrate.sh (locally written, see http://repo.mwt2.org/viewvc/performance-monitors). Also,
top was used to watch load on both iut2-dc1 and a few of the dCache pool nodes.
Results
The test began at 20:31:14 and finished at 22:03:12 - approximately 90 minutes. Data rate in to iut2-dc1: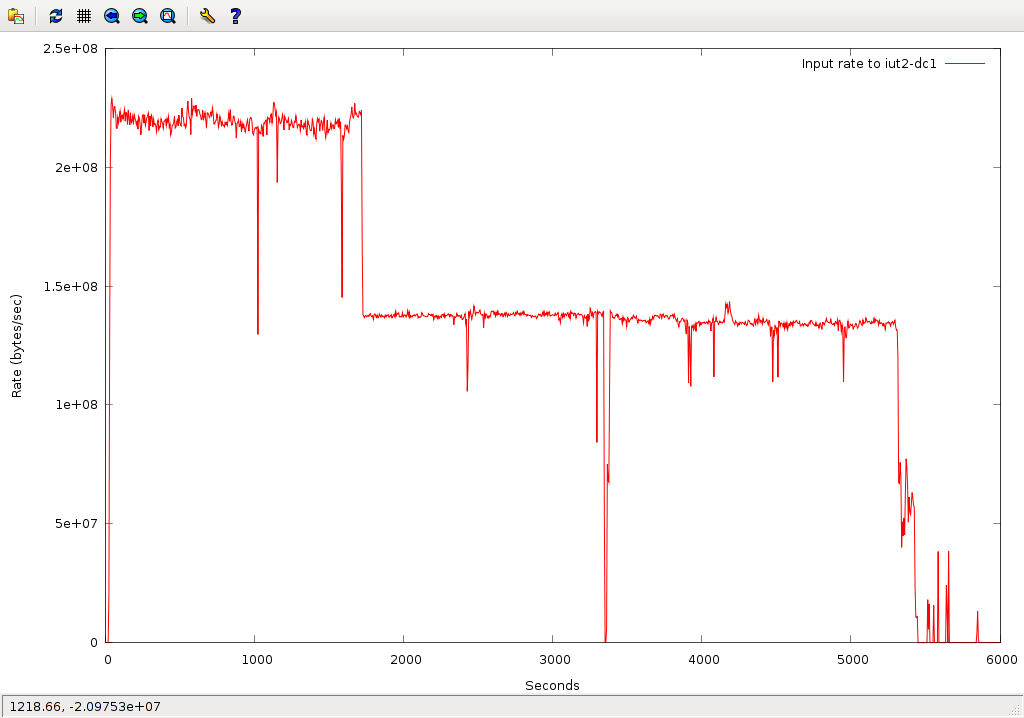
Discussion
This plot shows that the transfers started off at over 200MB/sec. During this part of the transfer,top on iut2-dc1 looked like this:
top - 21:54:00 up 7 days, 12:02,  5 users,  load average: 6.32, 7.24, 5.42
Tasks: 131 total,   2 running, 129 sleeping,   0 stopped,   0 zombie
Cpu(s):  2.9% us, 59.0% sy,  0.0% ni, 29.8% id,  0.1% wa,  8.2% hi,  0.0% si
Mem:   8251120k total,  8235124k used,    15996k free,     2024k buffers
Swap:  2097136k total,        0k used,  2097136k free,  7102736k cached

  PID USER      PR  NI  VIRT  RES  SHR S %CPU %MEM    TIME+  COMMAND
 3282 root      25   0  862m 571m 7380 S  271  7.1 552:51.23 java
 3608 root      21   0  688m  61m 7252 S    3  0.8   2:40.61 java
   71 root      15   0     0    0    0 S    0  0.0   0:02.73 kswapd0
This is a 4-core host so a load of 6 is slightly high. Process 3282 is the gridftp door and is running multiple threads on multiple cores. The recent CPU and RAM upgrades are apparent here - previously this host had 2 cores and CPU usage would not have been above 200%. A typical dCache pool node (iut2-c010) looked like this:
top - 21:42:14 up 76 days,  6:17,  1 user,  load average: 0.47, 0.40, 0.20
Tasks:  87 total,   1 running,  86 sleeping,   0 stopped,   0 zombie
Cpu(s):  0.2% us,  1.3% sy,  0.0% ni, 88.3% id, 10.0% wa,  0.1% hi,  0.0% si
Mem:   8316148k total,  7429560k used,   886588k free,     2008k buffers
Swap:  8193140k total,      208k used,  8192932k free,  7191672k cached

  PID USER      PR  NI  VIRT  RES  SHR S %CPU %MEM    TIME+  COMMAND
 8761 root      25   0  686m  71m 7252 S    5  0.9  22:49.15 java
27914 root      15   0     0    0    0 D    1  0.0   0:02.90 pdflush
    1 root      16   0  2884  544  464 S    0  0.0   0:02.60 init
This host was not running any Atlas jobs so the load is due to dCache
duty only. One can see that being a dCache pool node adds about 0.5
to the system load, or approximately half a core. Note the pdflush
process in state "D" (doing disk I/O) as well as process 8761, the
dCache pool process.
Also apparent in the above plot, unfortunately, is a sharp dropoff
after 1500 seconds (25 minutes).
At first this was not apparent, but in fact only 65 of the worker nodes
completed the 10 transfers. After the first 3 iterations, many of the
transfers failed, or worse yet, left files in dCache with incorrect sizes -
short writes.
These files should all be 1073741824 bytes. This is just a sample of
the short files, there are 97 in all.
-rw-r--r--  1 usatlas3 usatlas  145631152 May  1 22:27 1GB-uct2-c001-0501-5
-rw-r--r--  1 usatlas3 usatlas  418830032 May  1 22:27 1GB-uct2-c002-0501-5
-rw-r--r--  1 usatlas3 usatlas   93963616 May  1 22:27 1GB-uct2-c003-0501-5
-rw-r--r--  1 usatlas3 usatlas  270748160 May  1 22:27 1GB-uct2-c004-0501-5
-rw-r--r--  1 usatlas3 usatlas  184108856 May  1 22:27 1GB-uct2-c005-0501-5
-rw-r--r--  1 usatlas3 usatlas  414791440 May  1 22:27 1GB-uct2-c006-0501-5
-rw-r--r--  1 usatlas3 usatlas  417796696 May  1 22:27 1GB-uct2-c007-0501-5
Only a total of 746GB were delivered (out of 1000GB). There are 722 files with the correct sizes. There are however no zero-size files. When the transfers started to fail, the worker nodes reported errors like this:
c005    error: globus_xio_tcp_driver.c:globus_l_xio_tcp_system_connect_cb:1792:
c005    Unable to connect to iut2-dc1.iu.edu:2811
c005    globus_xio_system_select.c:globus_l_xio_system_handle_write:1886:
c005    System error in connect: Connection refused
However, the 65 worker nodes which managed to complete the 10-transfer loop should have been sufficient to keep up an aggregate rate of 200MB/sec, so I don't understand the droppoff to 138MB/sec. In tests going the other direction (IU->UC) I was able to get 200MB/sec using only 10 or 20 writers. During this phase,
top on iut2-dc1 looked like this:
top - 22:08:39 up 7 days, 12:16,  5 users,  load average: 3.36, 4.90, 5.28
Tasks: 130 total,   1 running, 129 sleeping,   0 stopped,   0 zombie
Cpu(s):  4.1% us, 27.2% sy,  0.0% ni, 65.0% id,  0.0% wa,  3.7% hi,  0.0% si
Mem:   8251120k total,  8234308k used,    16812k free,     1840k buffers
Swap:  2097136k total,        8k used,  2097128k free,  7066252k cached

  PID USER      PR  NI  VIRT  RES  SHR S %CPU %MEM    TIME+  COMMAND
 3282 root      25   0  858m 602m 7380 S  120  7.5 579:03.75 java
 3608 root      21   0  688m  61m 7252 S    3  0.8   3:10.16 java
   71 root      15   0     0    0    0 S    0  0.0   0:05.14 kswapd0
CPU utilization by the java process running running gridftp is considerably lower than during the 200MB/sec phase. The reason for the drop off is not understood at this time.
Next steps (written May 1 2008)
Repeat the test, both in this direction and other direction.Follow-up (added May 5 2008)
Similar tests have been using combinations of readers and writers at IU and UC. When data is written to uct2-dc1, the rate is consistently above 200MB/sec. When data is written to iut2-dc1, regardless of whether the writers are at UC or IU, I have not been able to reproduce the 200MB/sec result that is seen in the plot above for the first 25 minutes - the 138MB/sec ceiling seems to be permanently in effect. This has nothing to do with the network link between UC and IU, and nothing to do (as far as I can tell) with the fact that some of the writer processes failed in the test - however there may be some root problem which caused both the writer failures and the low rates. Restarting gridftp server on iut2-dc1 does not restore performance.iperf tests from iut2-dc3 to iut2-dc1 show a rate of 500MB/sec. So there is something
peculiar to the gridftp server.
-- CharlesWaldman - 02 May 2008
Edit | Attach | Print version | History: r3 < r2 < r1 | Backlinks | View wiki text | Edit wiki text | More topic actions
Topic revision: r3 - 06 May 2008, CharlesWaldman
Ideas, requests, problems regarding Foswiki? Send feedback